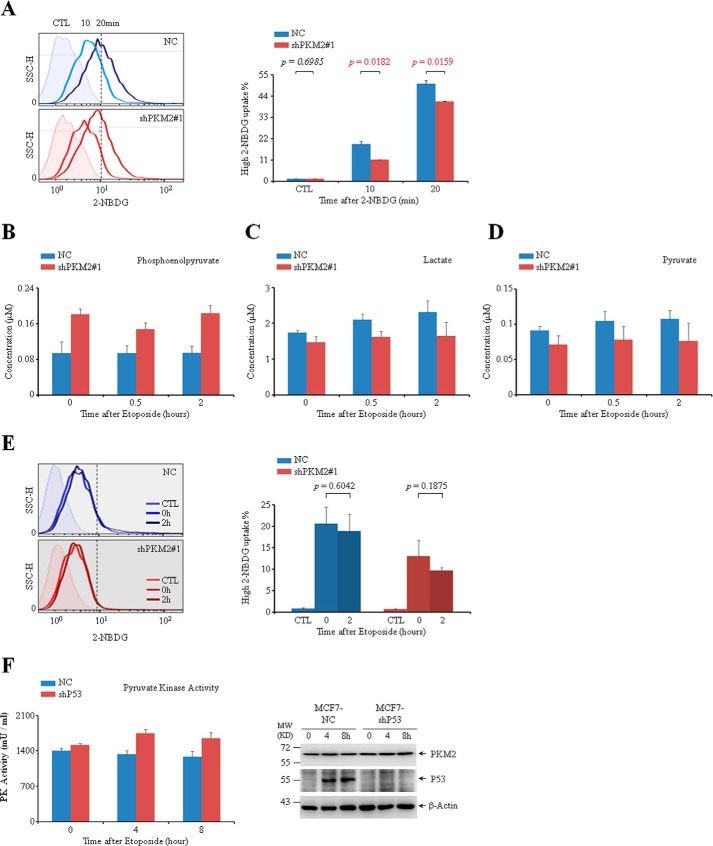
FIGURE 6.
The catalytic activity of PKM2 in response to DNA damage stimuli. A, flow cytometric analysis of glucose uptake in MCF7 cells infected with NC or shPKM2#1 after the cells were incubated with 2-NBDG for 10 or 20 min. CTL (control) represents data of negative control collecting from cells without 2-NBDG incubation. The cells on the right of the dotted lines were defined as ones with the relative high 2-NBDG uptake, and their percentages were shown. B–D, fluorometric measurement of the relative concentration of PEP (B), lactate (C), and pyruvate (D) in MCF7 cells infected with NC or shPKM2#1 followed by treatment with etoposide for 0, 0.5, or 2 h. E, flow cytometric analysis of glucose uptake in MCF7 cells infected with NC or shPKM2#1 and treated with or without etoposide for 2 h. The percentages of cells with the relative high 2-NBDG uptake were quantified and shown on the right. F, fluorometric measurement of the pyruvate kinase activity (left panel) and Western blot analysis (right panel) of MCF7 cells infected with NC or sh53.

