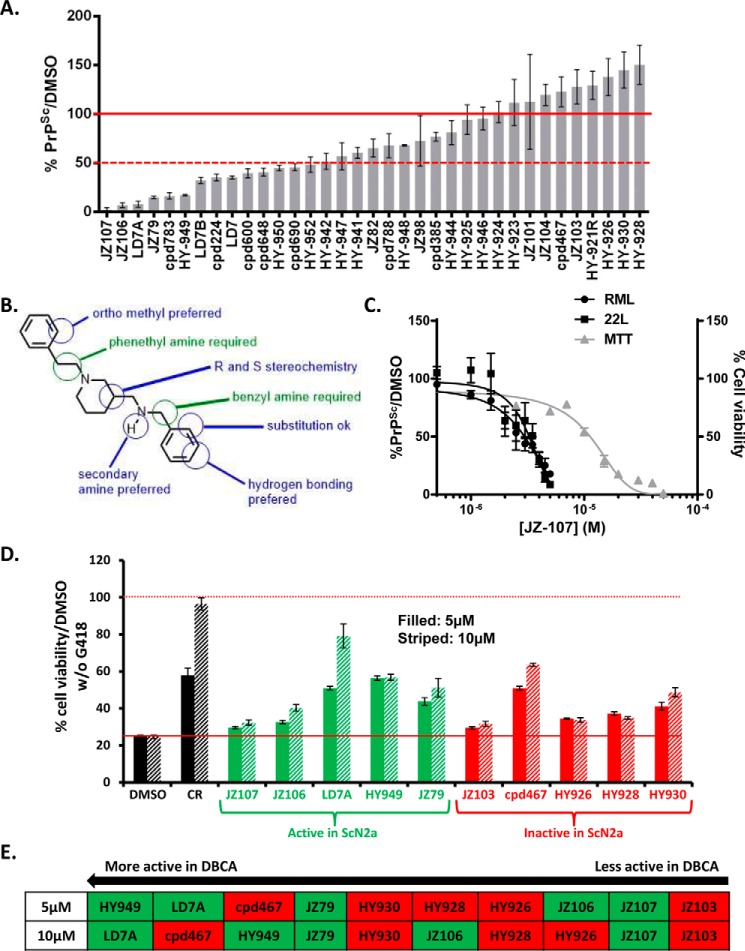
FIGURE 4.
Structure-activity relationships of LD7, and identification of active and inactive derivatives. A, effect of 34 derivatives of LD7 (structures shown in supplemental Fig. S2) on PrPSc levels in RML-ScN2a cells treated for 1 week with each compound at 7.5 μm, expressed relative to DMSO control. Bars represent mean ± S.D. (n = 3 cultures). B, pharmacophore of the LD7 class of compounds, based on the structure-activity data shown in panel A. C, dose-response curves showing the amount of PrPSc remaining in ScN2a cells after 1 week of treatment with the indicated concentrations of JZ-107 (left ordinate,) and viability of cells measured by MTT (right ordinate). The structure of JZ107 is shown in Fig. 5A. D, DBCA analysis of 10 LD7 derivatives: 5 compounds that were active in the ScN2a assay (green bars) and 5 compounds that were inactive in the ScN2a assay (red bars). Each compound was tested at concentrations of 5 μm (filled bars) and 10 μm (striped bars). Results are plotted as cell viability relative to cultures not exposed to G418. DMSO was used as a negative control and Congo Red (CR) as a positive control. E, ranking of the 10 LD7 derivatives based on their activity in the DBCA at 5 or 10 μm, from most active on the left to least active on the right. Compounds in the green and red boxes were active or inactive, respectively, in the ScN2a assay.

