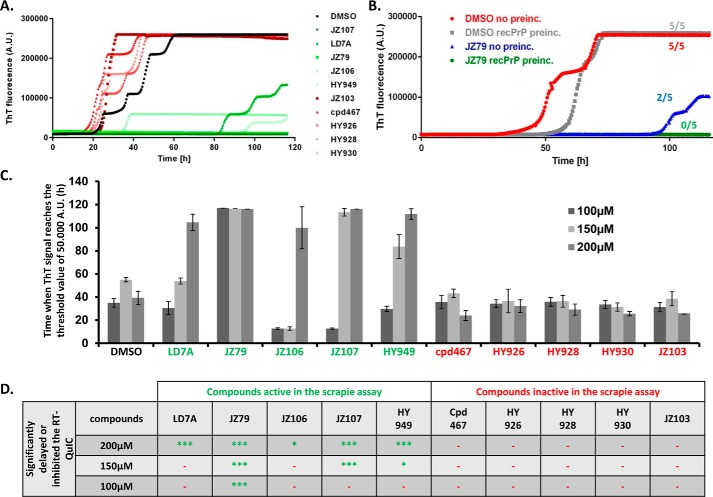
FIGURE 7.
Inhibitory activity of compounds in the RT-QuIC assay correlates with their inhibitory activity in the ScN2a assay. A, RT-QuIC conversion curves in the presence of DMSO (black), or 10 different LD-7 derivatives, each at 200 μm. Five of the derivatives were active in the ScN2a assay, and five were inactive. Curves are the average of 5 replicate wells. B, comparison of RT-QuIC reactions with and without 20 min preincubation of JZ79 (200 μm) with PrPC. The numbers next to each curve represent the number of wells (of a total of 5 wells for each condition) in which the ThT signal exceeded the threshold value by the end of the experiment. C, analysis of 3 different RT-QuIC experiments using the 10 LD7 derivatives at 100, 150, or 200 μm. Bars represents the time in hours (mean ± S.D., n = 5 wells) at which the thioflavin T signal reached a threshold value of 50,000 absorbance units. D, table showing whether each of the compounds significantly inhibited the RT-QuIC reaction (i.e. suppressed the conversion curves) at three different concentrations (100, 150, and 200 μm) (***, p < 0.001; *** or *, p < 0.05 by Student's t test, drug-treated versus DMSO control; −, no inhibitory effect).

