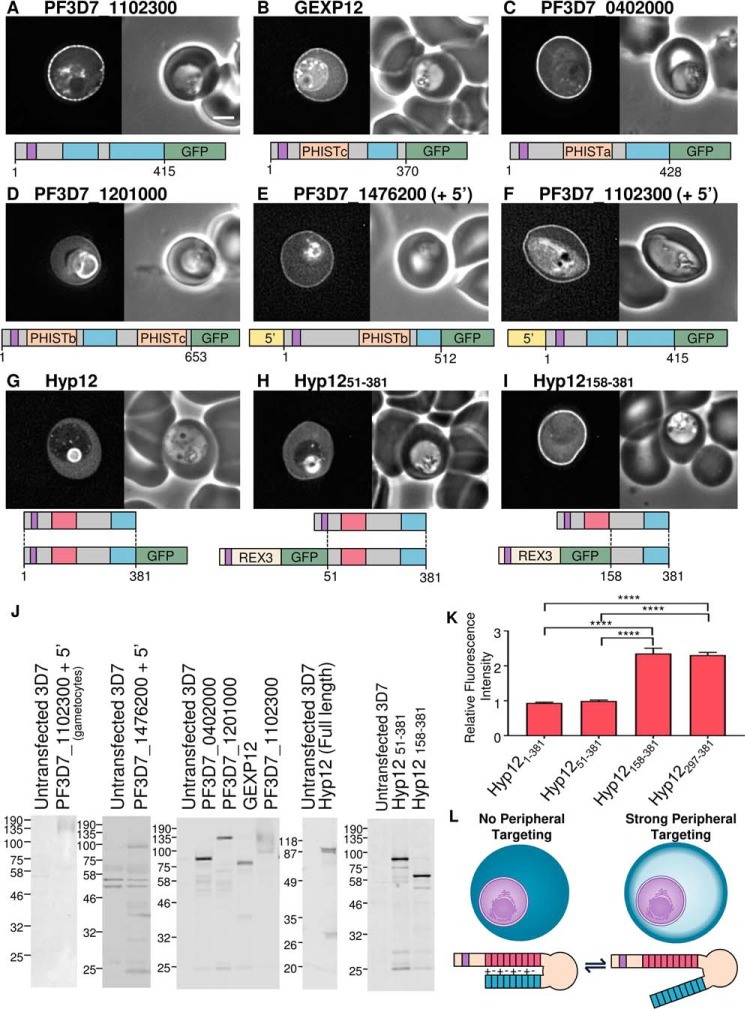
FIGURE 5.
Localization of lysine-rich repeat-containing proteins. A–I, identities of proteins are shown above each image. Shown are GFP localization (left) and a phase-contrast image (right). A representation of the full-length protein is shown below each image, with the lysine-rich repeat regions in blue, export sequences (signal sequence and PEXEL/HT motif) in purple, PRESAN/PHIST domains in orange, and acidic regions in red. Expressed fragments are also illustrated below G–I. Scale bar, 2 μm. J, anti-GFP Western blots of all parasite lines. K, ratio of the fluorescence intensity at the erythrocyte periphery relative to the erythrocyte cytoplasm, as in previous figures. ****, an extremely significant difference (p ≤ 0.0001). L, model showing the potential masking of the C-terminal lysine-rich sequence by the acidic N terminus of Hyp12. Error bars, S.E.

