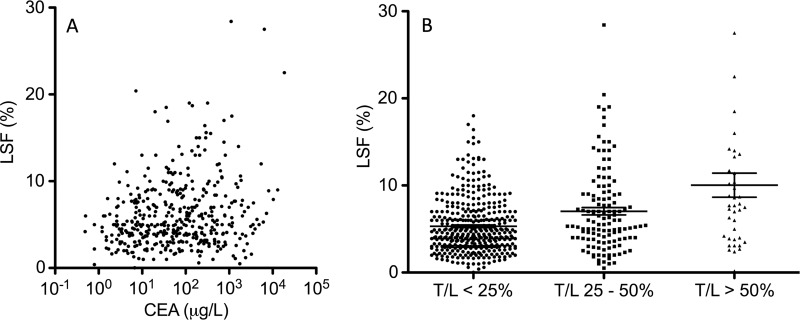
Figure 3:
Scatterplots illustrate the relationship of LSF to other prognostic determinants. A, Scatterplot of serum CEA level against LSF demonstrates a weak correlation (Pearson correlation coefficient, 0.105; P = .043). B, Grouped column scatterplot of tumor-to-liver volume ratio (T/L) against LSF demonstrates a weak correlation between increased tumor-to-liver volume ratios of at least 25% and LSF (Pearson correlation coefficient, 0.113; P = .013).

