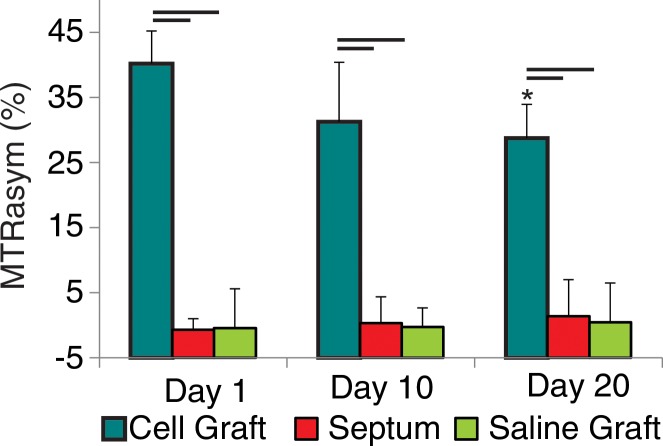
Figure 3a:
Bar graphs illustrate the measurement of MTRasym, which allows differentiation of (a) cell survival from (b) cell rejection. In C3H mice (a), MTRasym values in the region that contains Eu-HP-DO3A–labeled cells (cell graft) were significantly higher compared with septal regions (septum) in the same hearts and compared with corresponding regions after implantation of saline-labeled control cells (saline graft) in genetically identical mice at all measured time points. By 20 days after implantation, the mean MTRasym values in cell grafts were significantly lower when compared with values 1 day after implantation. In C57BL/6J mice (b), MTRasym values were increased 1 day after implantation in areas of Eu-HP-DO3A–labeled cells when compared with septal regions and saline-labeled controls and remained significantly increased 10 days after implantation but were similar 20 days after implantation. By 10 days, MTRasym values in the region of implanted Eu-HP-DO3A–labeled cells were significantly reduced compared with both the initial values 1 day after implantation and the corresponding values in C3H mice at identical time points. Bars represent P values less than .05 at identical time points. * = P < .05 versus day 1 in the same region, † = P < .05 versus cell graft in C3H mice at the same time point.

