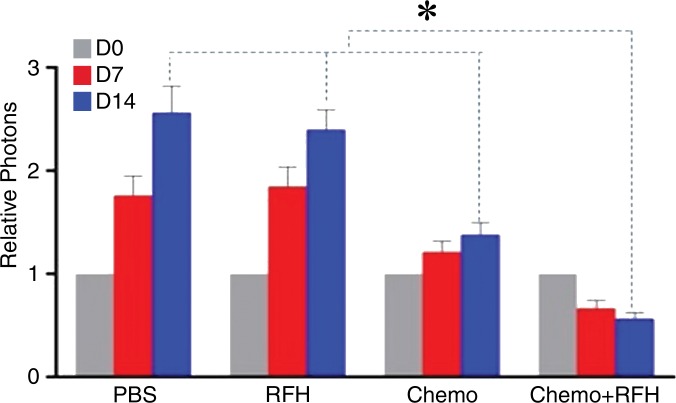
Figure 2d:
(a) US images and (b) optical and x-ray images show tumor growth and responses to treatments at days 0, 7, and 14. There was a statistically significant decrease in both relative tumor volume (arrows on a; graph c) and fluorescent signal intensity (yellow-red color on b, graph d) with combination therapy (chemotherapy and RF hyperthermia) compared with the other three treatment groups. RFH = radiofrequency heat.

