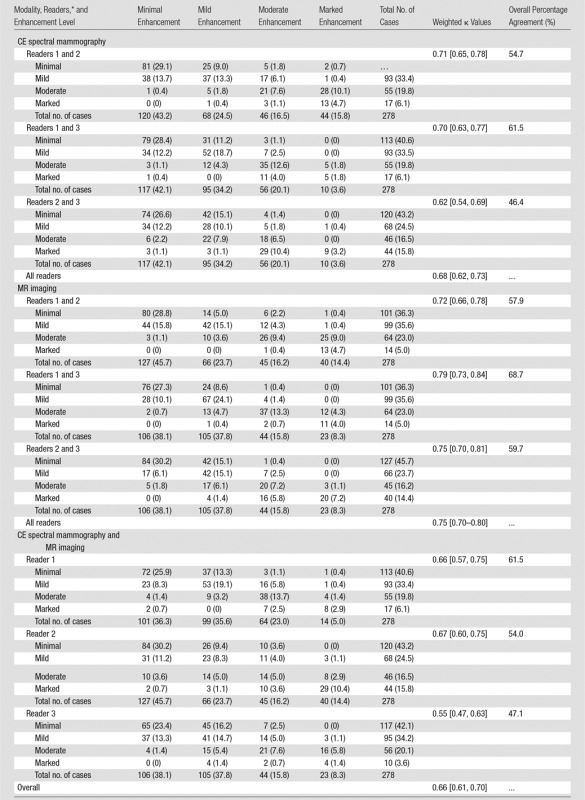
Table 2.
Agreement among Readers and between Imaging Modalities for Background Parenchymal Enhancement Categorization

Note.—Data are numbers of patients, with percentages in parentheses, unless indicated otherwise. Data in brackets are 95% CIs.
*The numbers in the text refer to a cross-tabulation of the two readers’ values, with the row values containing those of the first listed reader and CE spectral mammography and the columnar values containing those of the second listed reader and MR imaging.
