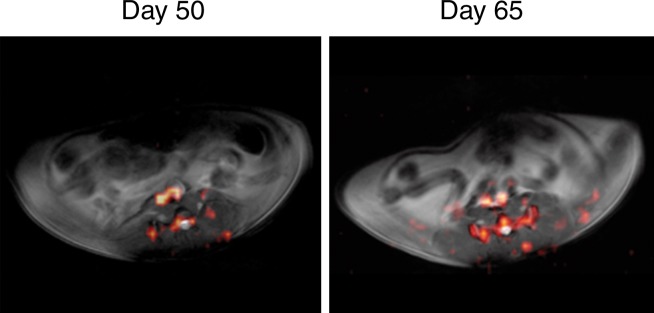
Figure 1b:
(a) In vivo axial merged 1H and 19F MR images of the abdomen in mice with colitis-associated dysplasia obtained at different days. Accumulation of PFCs is visible in the colon (black arrows) and vertebrae (white arrows). 19F signal intensity was also detected in the kidney at day 110 (arrowhead). (b) In vivo axial MR images in control mice at days 50 and 65 do not show 19F signal intensity in the colon. The 19F signal intensity is seen in only the vertebra and the iliac lymph nodes. PFC was injected on day 48, and no further PFC was given; therefore, control mice were not examined after day 65. (c) Graph shows normalized 19F SNR in all ROIs combined. The 19F signal intensity persisted over time. Error bars indicate standard error of the mean.

