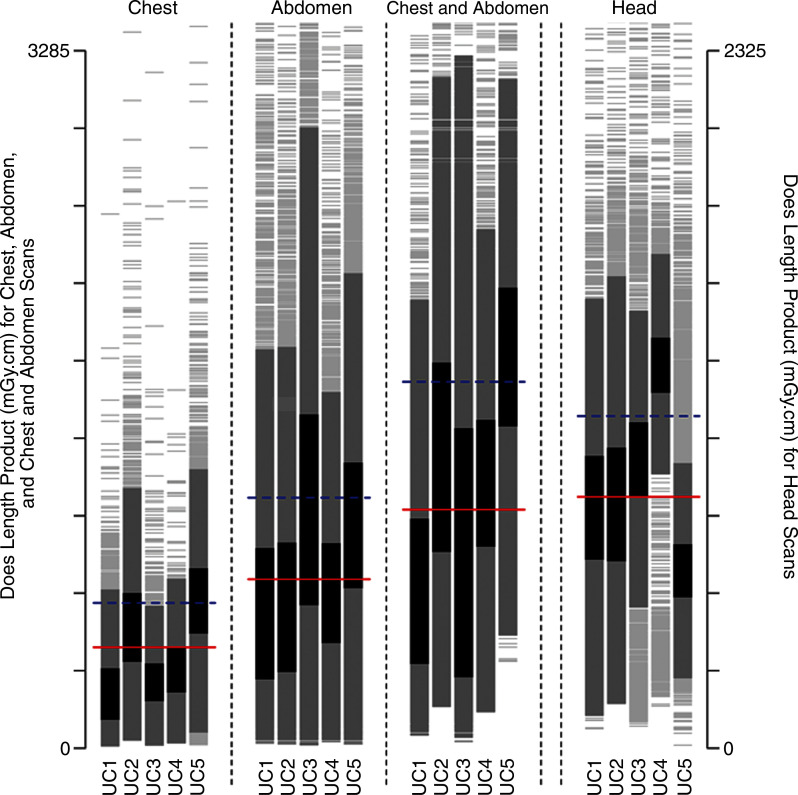
Figure 1d:
Distribution of dose metrics across the University of California Medical Centers for (a) CTDIvol and (b) effective dose. Vertical lines show the distribution of dose within an institution. Examinations between the 25th and 75th percentiles of each institution are darkest gray; examinations within 1.5 standard deviations of the median are medium gray; remaining examinations are light gray. Red lines show the median dose calculated across the five medical centers; blue lines show the 75th percentile in dose distribution calculated across all medical centers. (c) The 75th percentile in dose was defined for CTDIvol as 17.8 mGy for chest, 17.2 mGy for abdomen, 17.2 mGy for combined chest and abdomen, and 59.4 mGy for head. (d) The 75th percentile in dose was defined for effective dose as 14.9 mSv for chest, 21.2 mSv for abdomen, 33.1 mSv for combined chest and abdomen, and 2.8 mSv for head. The 75th percentile in dose for SSDE was defined as 19.2 mGy. Distribution of dose within each institution and anatomic area is shown with a vertical line, and horizontal lines indicate median dose (red line) and 75th percentile in dose (blue line) calculated across all five University of California medical centers for that anatomic area.

