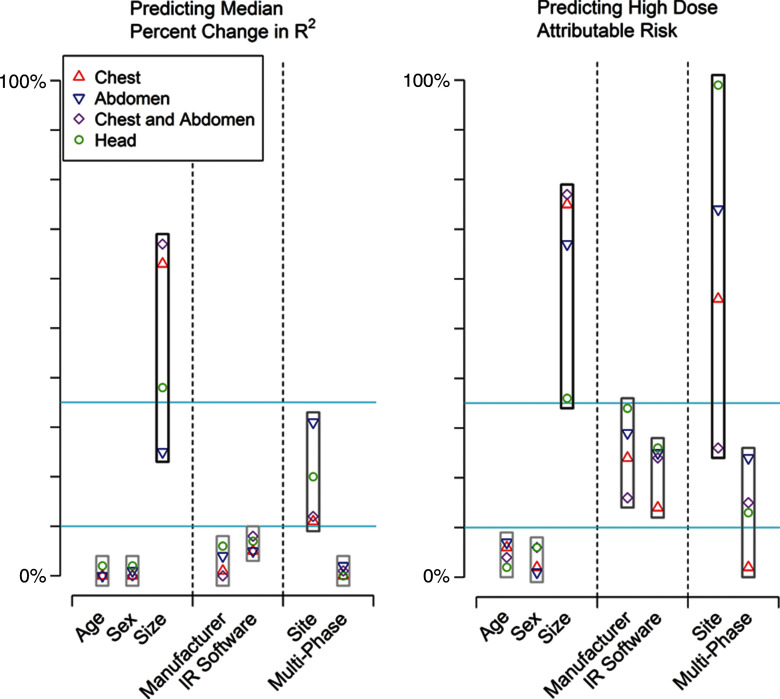
Figure 2a:
Importance of patient, vendor, and institutional variables in explaining variation in median change in R2 and high dose as attributable risk. IR = iterative reconstruction. For median (a) CTDIvol and (b) median effective dose, we categorized change in R2 and attributable risk as small (<10%), moderate (10%–25%), or large (>25%). Blue lines correspond to 10% and 25% values.

