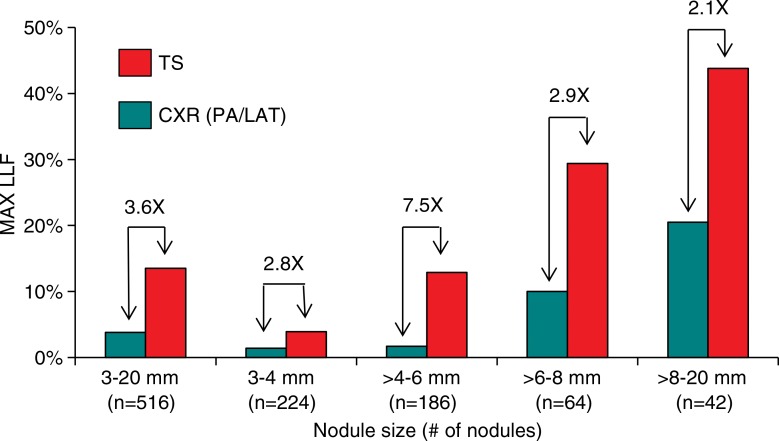
Figure 2:
Bar graph shows the detection sensitivity on a per-nodule basis as a function of nodule size. Results show sensitivity as determined by maximum LLF (MAX LLF) for all nodules visible to the truth panel on CT images. All differences between conventional chest radiography (CXR) and tomosynthesis (TS) are significant (P < .001 for nodules 3–20 mm; P = .002 for nodules 3–4 mm; P < .001 for nodules >4 mm to 6 mm; P < .001 for nodules >6 mm to 8 mm; and P < .001 for nodules >8 mm to 20 mm). LAT = lateral.

