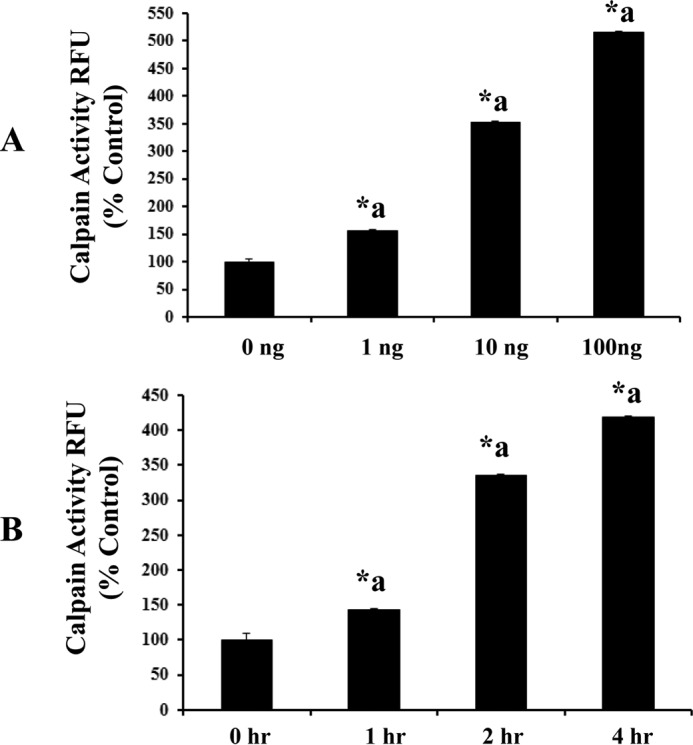
FIGURE 2.

IL-1β treatment (at concentrations 1, 10, and 100 ng/ml) as well as various time points (1, 2, and 4 h) induces calpain activity significantly (A and B, n = 5; p < 0.05). Calpain activity is expressed as RFU, plotted on the y axis. Data are expressed as mean ± S.E. *a indicates significant increase compared with the control (0 h) group.
