FIGURE 7.

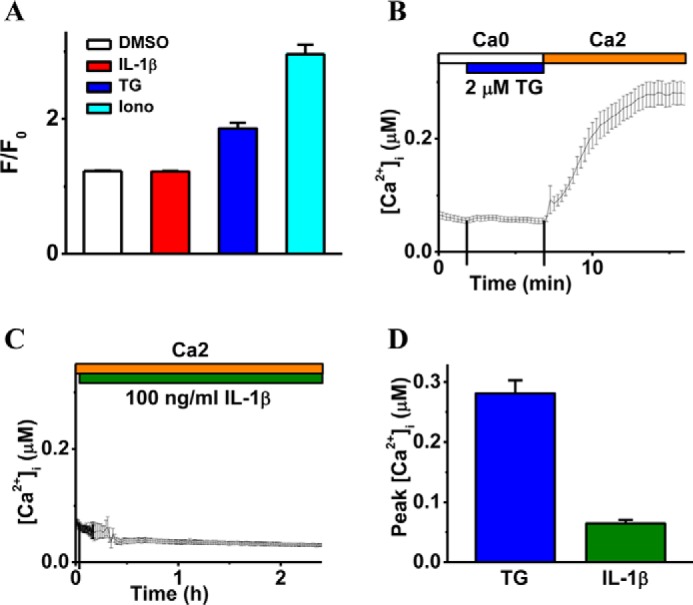
IL-1β treatment does not induce intracellular calcium mobilization. A demonstrates the effect of IL-1β treatment on intracellular calcium mobilization (F) relative to basal Ca2+ (F0) when measured 10 min after the application of DMSO (vehicle control), IL-1β (10 ng/ml), TG (2 μm), and Iono (1 μm) and displayed as mean ± S.E. (n = 4). B and C are the representative intracellular free calcium recordings ([Ca2+]i, mean ± S.E.) showing cytosolic Ca2+ levels coupled to TG (2 μm, B) or IL-1β (100 ng/ml, C) stimulation. The top bars indicate the type of extracellular solutions applied to the RBMECs, and the vertical lines on the x axis indicate the time of solution exchange. D displays averaged peak values of [Ca2+]i in response to TG (n = 40 cells) and IL-1β (n = 30 cells), respectively.
