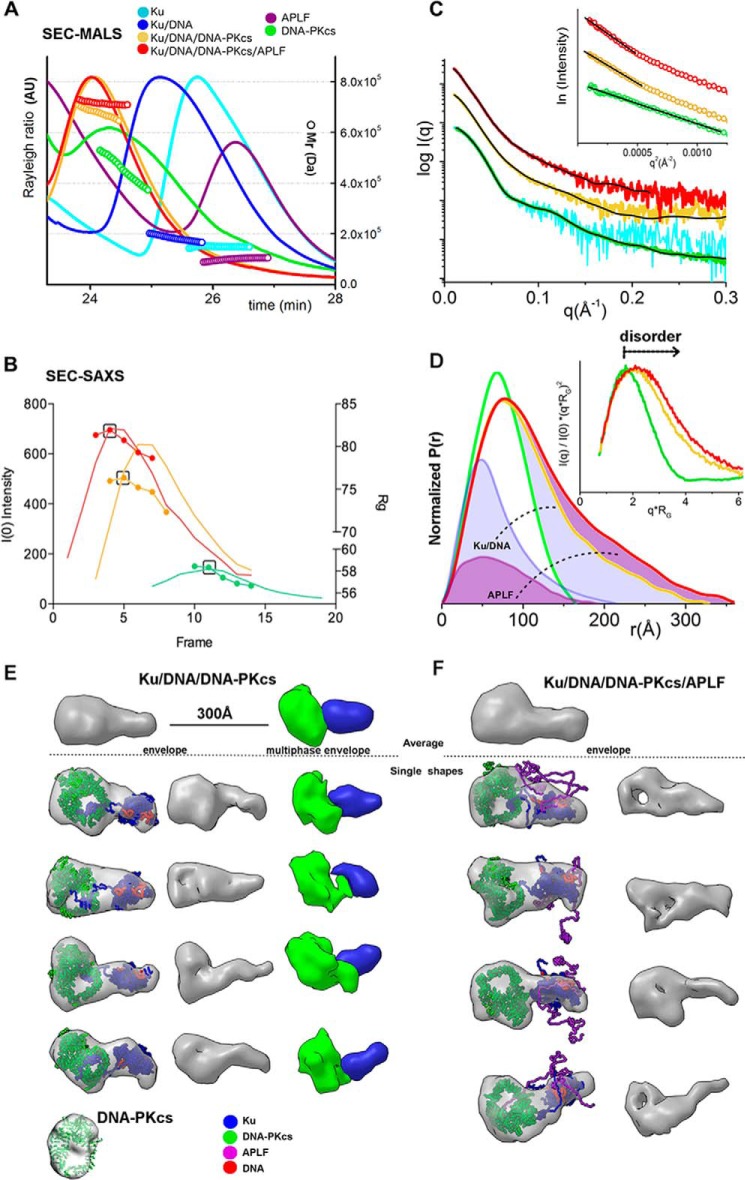
FIGURE 6.
Solution structure reconstructions of Ku·20bpDNA·DNA-PKcs·APLF complexes. A, SEC-MALS chromatographs for Ku (cyan), DNA-PKcs (green), APLF (purple), and Ku, Ku·DNA-PKcs or Ku·DNA-PKcs·APLF (blue, yellow, red, respectively) in the presence of 20bpDNA at molar ratios of 1:1:1:1 at a final concentration of 5.3 μm. Solid lines represent the light scattering signal (Rayleigh ratio in arbitrary units), the symbols represent molecular mass versus elution time. B, SEC-SAXS profiles for DNA-PKcs (green), Ku·20bpDNA·DNA-PKcs (yellow) and Ku·20bpDNA·DNA-PKcs·APLF (red) showing I(0) (lines) and Rg (symbols) values are shown for each collected frame across the SEC peak. The black box indicates the frame, which gives the SAXS profile (shown in the panel C)) used in the SAXS analysis. C, SAXS curves for DNA-PKcs (green, taken from Ref. 25; cyan, curve obtained from SEC-SAXS), Ku·20bpDNA·DNA-PKcs (yellow), and Ku·20bpDNA·DNA-PKcs·/APLF (red) complexes. Inset: Guinier plot for the SAXS curves. The black line shows the model fit for the single phase envelope (Ku·20bpDNA·DNA-PKcs·APLF) calculated by DAMMMIF or multiphase envelope with the individual phases DNA-PKcs, Ku·20bpDNA·DNA-PKcs calculated by MONSA. D, P(r) calculated for the experimental SAXS of DNA-PKcs (green), Ku·20bpDNA·DNA-PKcs (yellow), and Ku·20bpDNA·DNA-PKcs·APLF (red) shown in panel C. The area of the P(r) is normalized relative to the MrSAXS listed in Table 1. Inset, dimensionless Kratky plots for DNA-PKcs (green), Ku·20bpDNA·DNA-PKcs (yellow), and Ku·20bpDNA·DNA-PKcs·APLF (red) indicate the level of disorder as indicated. E and F, four representative SAXS envelopes of Ku·20bpDNA·DNA-PKcs and Ku·20bpDNA·DNA-PKcs·APLF complexes superimposed with the atomistic model of Ku·20bpDNA and DNA-PKcs crystal structure (30). The right panel shows envelopes in ∼70% of their volume to highlight the hollow feature of the DNA-PKcs central region. E, far left panel: representative single and average multiphase envelopes of Ku·20bpDNA·DNA-PKcs. Phases for DNA-PKcs and Ku·DNA are colored as indicated. Model fit for the individual phases and complexes are shown in the panel C. Models in all panels are to the same scale.

