
FIGURE 8.
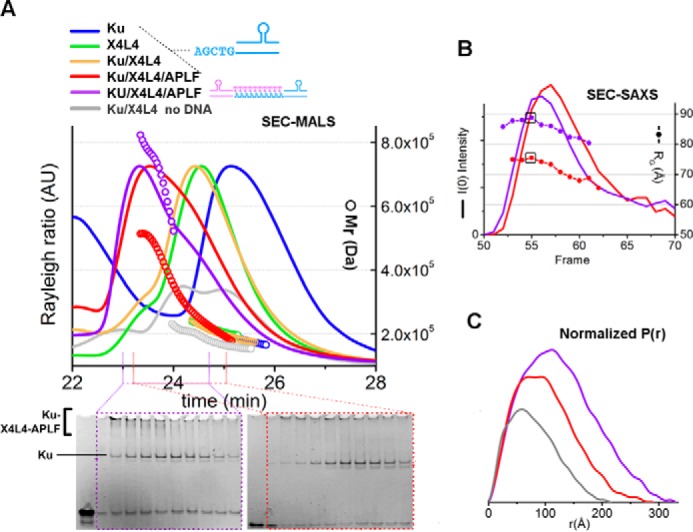
SEC-MALS and SEC-SAXS of the Ku·X4L4·APLF complex. A, SEC-MALS chromatographs for Ku (blue), X4L4 (green), Ku·X4L4 (yellow), and Ku·X4L4·APLF (red) in the presence of one 20bpDNA or two 20bpDNA-10nt with complementary end groups at molar ratios of 1:1:1:1 (final concentrations 14 μm). Solid lines represent the light scattering signal (Rayleigh ratio in arbitrary units), the symbols represent molecular mass versus elution time. Bottom panels show EMSA gels for the SEC-MALS peak fraction for Ku·20bpDNA·X4L4·APLF in the presence of one 20bpDNA (red) or two 20bpDNA-10nt with complementary end groups (violet). B, SEC-SAXS profiles for Ku·X4L4·APLF in the presence of stem-loop DNA molecules with either one (20bpDNA, red) or two complementary ends (20bpDNA-10nt, violet). I(0) (lines) and Rg (symbols) values are shown for each collected frame across the SEC peak. The black box indicates the frame that gives the SAXS curves (shown in Fig. 9E) used in further SAXS analysis. C, P(r) of X4L4 (gray) and Ku·X4L4·APLF in the presence of one 20bpDNA (red) or two 20bpDNA-10nt (violet) as indicated in panel A. P(r) have been calculated for the SAXS curves shown in Fig. 9E. The area of the P(r) is normalized relative to the MrSAXS listed in the Table 1.