FIGURE 5.
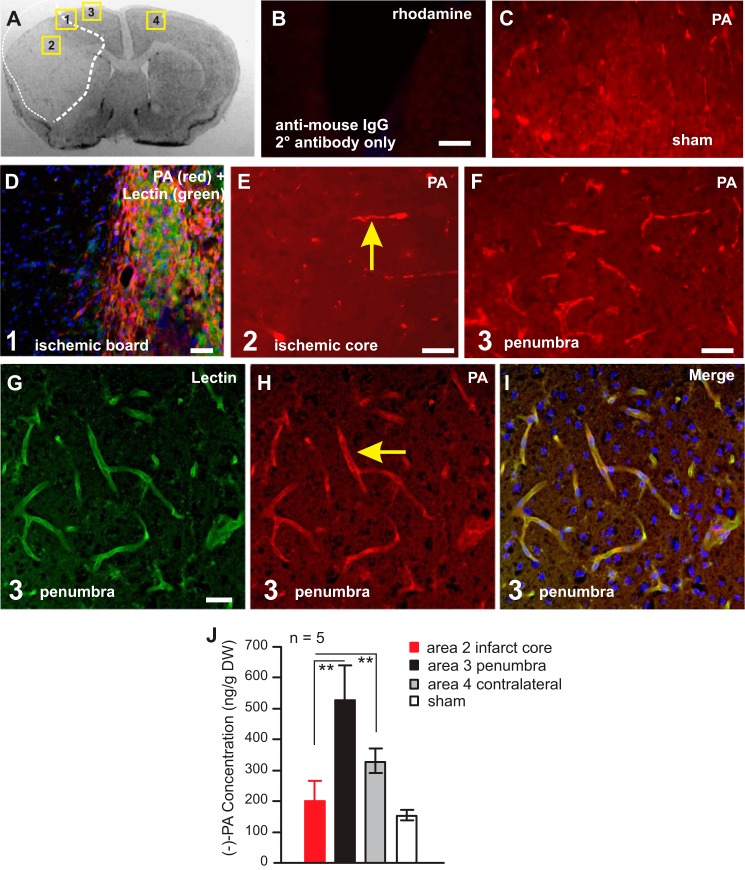
MCAO elevated (−)-PA level in the non-ischemic tissue. An example of a coronal section of the ischemic brain is shown in A. Numbers 1–4 in the squares in A indicates areas of interest. PA immunostaining omitting the primary antibody was performed to show tissue specificity (B). The expression of PA in sham-operated mouse brain (C) and ischemic brain (D–I) were examined under a fluorescence microscope. Lectin was labeled as green fluorescence in D and G. Co-localization of lectin with PA is shown in I. Laser capture microdissection was used to obtain tissues from areas of interests as indicated in A. These samples were subjected to UPLC/MS/MS analysis to detect (−)-PA levels as shown in J. Error bars represent the mean ± S.E. ** indicates p < 0.05 compared with area 2 of tissues from the infarct core (one-way ANOVA with Tukey's post hoc analysis; n = 5). Scale bars, 50 μm.

