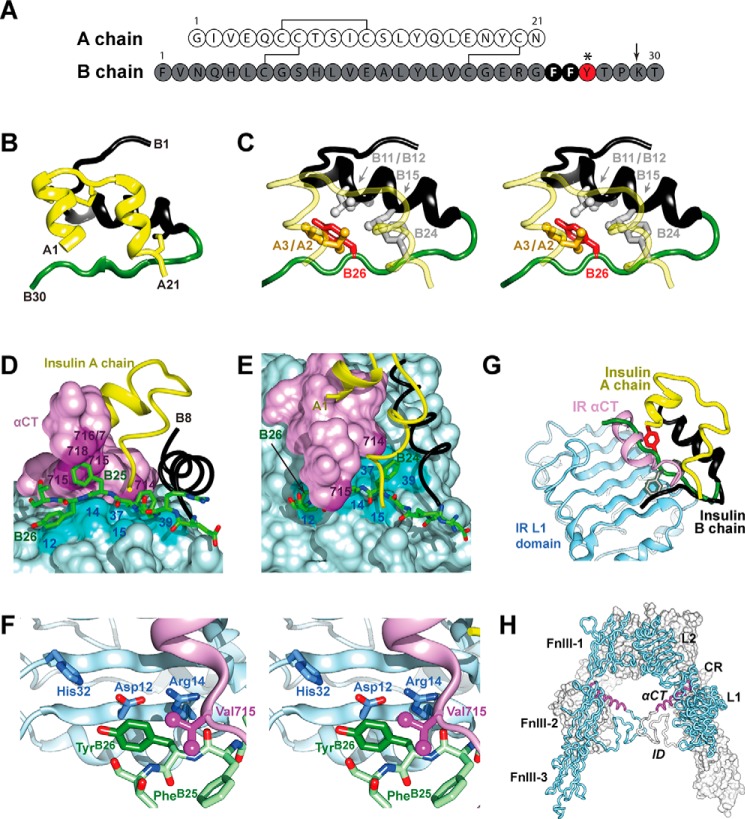
FIGURE 1.
Insulin sequence and structure. A, sequence of WT insulin and modification sites. A and B chains are shown in white and gray. Conserved aromatic residues PheB24 and PheB25 are highlighted as black circles. This study focused on substitutions of TyrB26 (red circle); additional substitutions were made at position B29 (Nle; arrow) to facilitate semi-synthesis. B, ribbon model of insulin monomer (T state extracted from T6 zinc hexamer) (2). The A chain is shown in yellow and the B chain in black (B1–B19) and green (B20-B30). C, environment of TyrB26 (stereo). The side chain of TyrB26 is highlighted in red; IleA2, ValA3, ValB12, LeuB15, and PheB24 are as labeled. D, stick representation of residues B20–B27 (carbon atoms (green), nitrogen atoms (blue) and oxygen atoms (red)) packed between αCT and the L1-β2 sheet. B chain residues B8–B19 are shown as a black ribbon and the A chain as a yellow ribbon; residues A1–A3 are concealed behind the surface of αCT. Key contact surfaces of αCT with B24–B26 are highlighted in magenta, and L1 with B24–B26 are highlighted in cyan; L1 and αCT surfaces not in interaction with B24–B26 are shown in lighter shades. E, orthogonal view to D, showing interaction of the side chain of PheB24 with the nonpolar surface of the L1-β2 sheet. TyrB26 is hidden below the surface of αCT. Engagement of conserved residues A1–A3 against the nonpolar surface of αCT is shown at top. F, environment of TyrB26 within site 1 complex (stereo). Neighboring side chains in L1 and αCT are as labeled. Coordinates were obtained from PDB code 4OGA (39). G, model of wild-type insulin in its receptor-free conformation overlaid onto the structure of the insulin-bound μIR (71). The L1 domain and part of CR domain are shown in powder blue; αCT is shown in purple. Residues PheB24 and TyrB26 are as in A. The B chain of μIR-bound insulin is shown in dark gray (B6–B19); the brown tube indicates classical location within the overlay of residues B20–B30 of insulin in its receptor-free conformation, highlighting steric clash of B26–B30 with αCT. In the μIR co-crystal structure, insertion of the insulin B20–B27 segment between L1 and αCT peptide is associated with a small rotation of the B20–B23 β-turn and changes in main-chain dihedral angles flanking PheB24 (39). H, inverted V-shaped assembly of IR ectodomain homodimer. One monomer is in ribbon representation (labeled), the second in surface representation. Domains are labeled as follows: L1, first leucine-rich repeat domain; CR, cysteine-rich domain; L2, second leucine-rich repeat domain; FnIII-1, -2, and -3, first, second, and third fibronectin type III domains, respectively; ID, insert domain; and αCT, α-chain C-terminal segment. Coordinates were obtained from PDB code 4ZXB (42).

