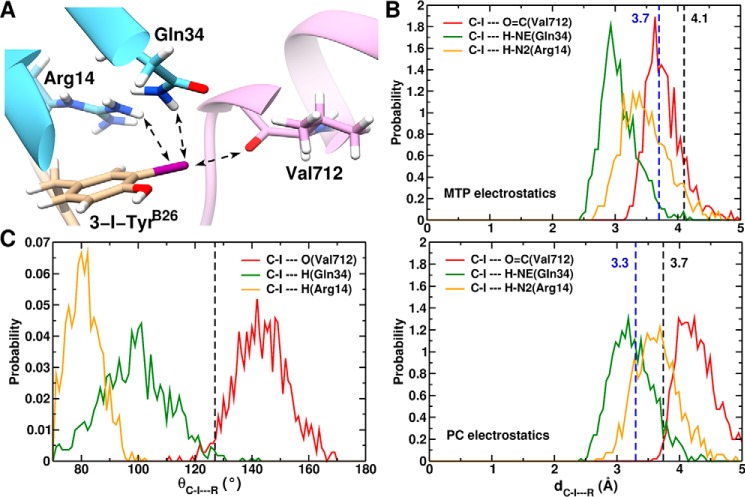
FIGURE 8.
MD-based model of μIR/3-[iodo-TyrB26]insulin interface. A, structure of 3-[iodo-TyrB26]insulin bound to the μIR. Only μIR residues interacting with 3-I-TyrB26 are illustrated. Potential hydrogen/halogen bonds with iodine are shown as dashed arrows. B, probability distribution along the C-I···R distance, where R is (O=C(Val-365)) (red line); R is (H-Nϵ(Gln-81)) (green line); or R is (N2(Arg-61)) (dashed orange line). The upper panel is from simulations with MTP electrostatics, whereas the lower panel uses point charges. The black dashed lines at 4.1 Å (3.7 Å, lower panel) represents the C-I···O(Val-365) interaction limit using optimized van der Waals radii for the iodine and oxygen atoms. Dashed lines at 3.7 Å (3.3 Å, lower panel) indicate the C-I···H (Gln-34 and Arg-14) distance using optimized van der Waals radii for iodine and polar H-atoms. C, probability distribution of the halogen/hydrogen bond angular variation θC-·R from 1 ns of MD simulation. The black dashed line at 127° represents the boundary between the negative (δ− < 127°) and positive electrostatic region (127° 〈δ+〉 233°) for I.

