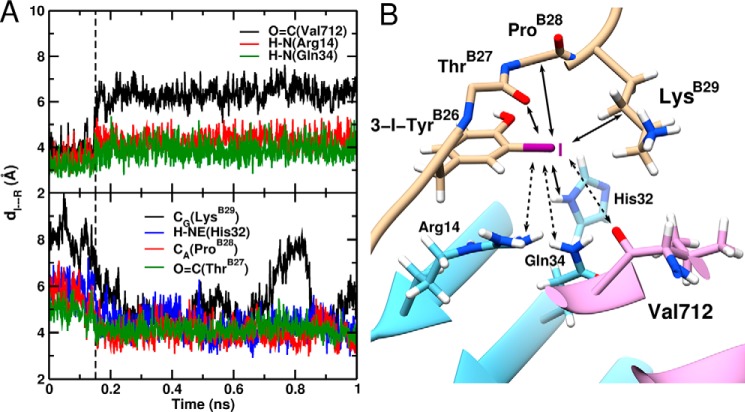
FIGURE 9.
MD-based model of μIR/3-[iodo-TyrB26]insulin interface assuming neutral iodine. A, time evolution of the I···R distance (distance of TyrB26-I to the interacting insulin/μIR residues). The upper and lower panels show the increase of the I···O=C(Val-365), I···H-N(Arg-61), and I···H-N(Gln-81) bond lengths, respectively, and the decrease of the I···Cγ(LysB29), I···H-NE(His-79), I···Cα(ProB28), and I···O=C(ThrB27) bond lengths in the course of the MD simulation. The black dashed line at 150 ps represents the point when the electrostatically driven interactions dissociate and the van der Waal-driven interactions form. B, snapshot structure of 3-[iodo-TyrB26]insulin bound to the μIR. Only the residues interacting with 3-I-TyrB26 are illustrated. Bond formation/dissociation with the iodine atom are shown as full and dashed line arrows, respectively.

