FIGURE 4.
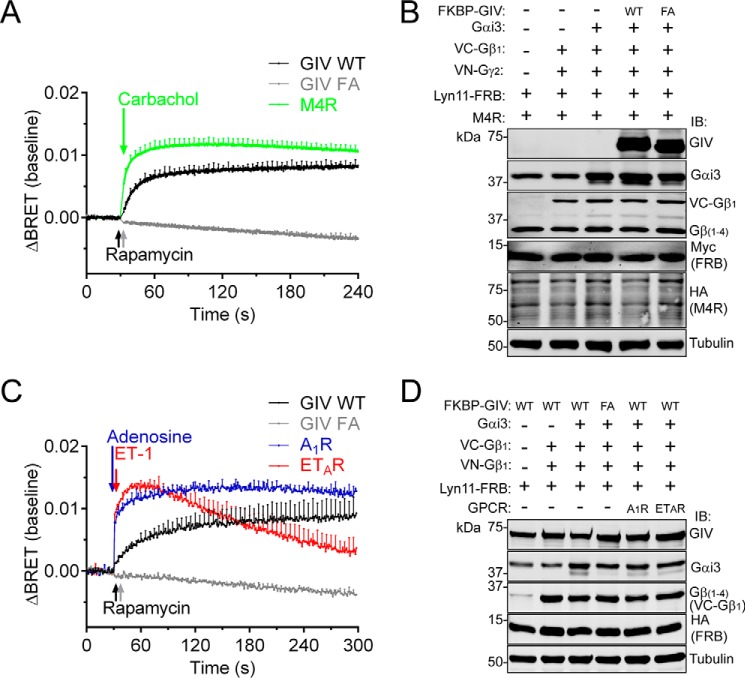
The amplitude and kinetics of G protein activation induced by the recruitment of GIV to membranes is comparable with GPCR-mediated activation. HEK293T cells were transfected with plasmids for all the components required for CID (1 μg FKBP-GIV WT/FA) and for BRET-based G protein activity measurements as described in Fig. 3 and different GPCRs (M4R in A and B and the A1R and ETAR in C and D). The cells were stimulated with rapamycin (0.5 μm), carbachol (100 μm), adenosine (0.1 μm), or ET-1 (3 μm) at the indicated times (arrows). BRET results (A and C) are the average of three to five independent experiments (baseline corrected by subtraction of the BRET values before stimulation), and the error bars are the S.E. (shown only at 5-s intervals for clarity). Representative immunoblots of the cells used in these experiments are shown in B and D.

