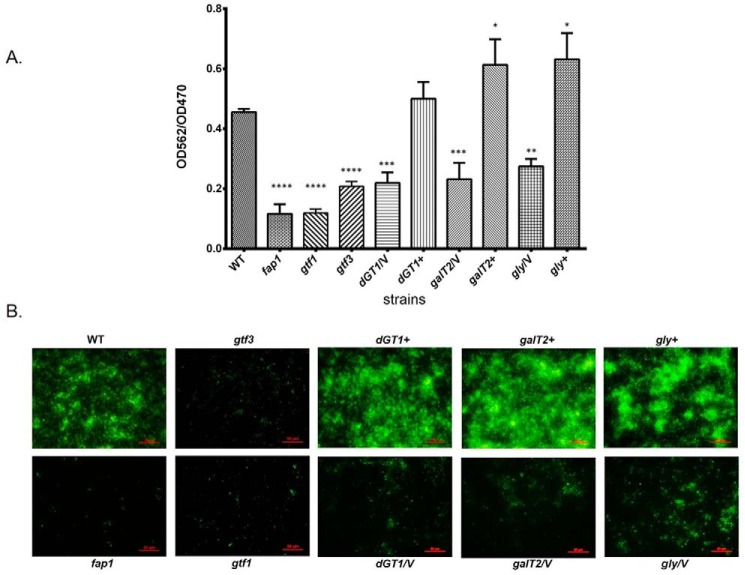
FIGURE 5.
Disruption of glycosyltransferases altered biofilm formation. A, quantitative analysis of biofilms by microtiter plate. In vitro biofilm assays were performed as described under “Experimental Procedures.” Biofilms stained by crystal violet in the microtiter wells were extracted and quantified by measuring absorbance at 562 nm. The biofilms were normalized by bacterial growth using A562/A470. The bars represent the mean measurements from three independent experiments. *, p < 0.05; **, p < 0.01; ***, p < 0.001; ****, p < 0.0001 (two-tailed unpaired Student's t test). B, florescent microscopy analyses of biofilms. Biofilms of wild type (WT), fap1 mutant (fap1), gtf1 mutant (gtf1), gtf3 mutant (gtf3), dGT1 mutant (dGT1/V), galT2 mutant (galT2/V), gly mutant (gly/V), and their complementary strains (dGT1+, galT2+, gly+) were formed on the μ-Slide 8-well plates, then stained with SYTO 9, and examined by florescent microscopy. Bar, 50 μm. /V, with an empty vector pVPT. +, complementation of a corresponding mutant.

