FIGURE 2.
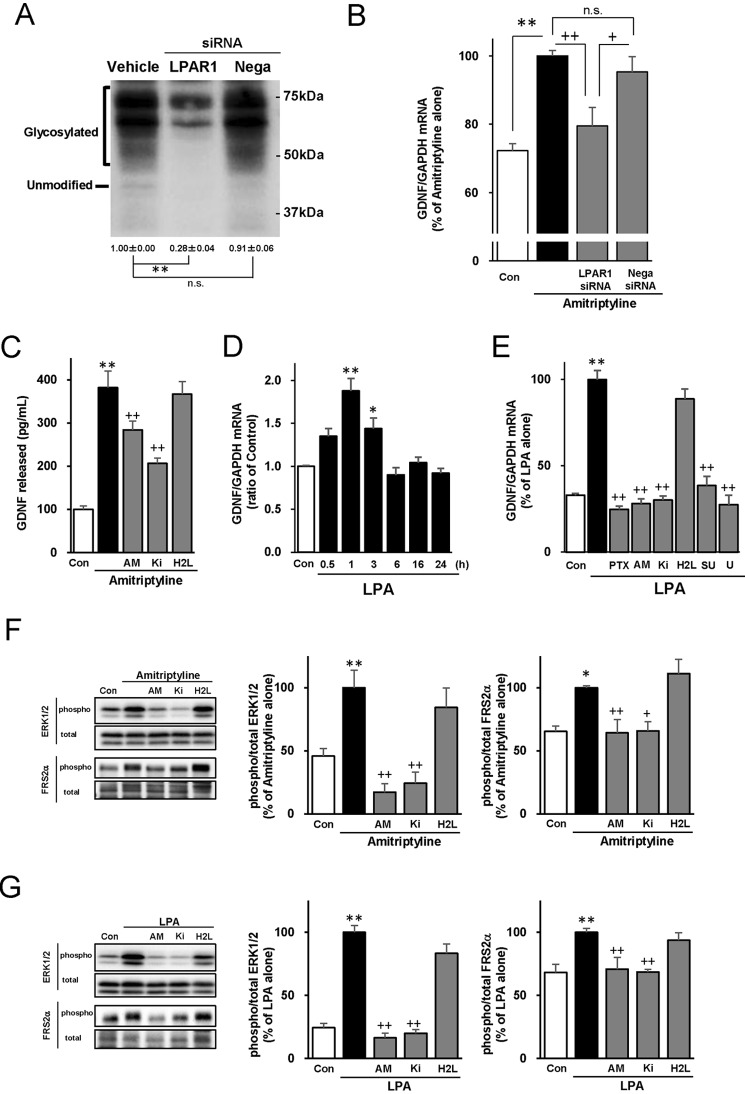
The involvement of LPAR1 in amitriptyline- and LPA-evoked GDNF expression, ERK1/2, and FRS2α in C6 cells. A, effect of LPAR1 siRNA on LPAR1 protein levels. Cells were transfected with vehicle, LPAR1 siRNA, or negative control (Nega) siRNA for 48 h. LPAR1 proteins were quantified by immunoblotting. Immunoblots from a representative experiment are shown. The numbers under the immunoblots indicate mean ± S.E. relative-fold change in expression compared with vehicle. **, p < 0.01; n.s., not statistically significant (Bonferroni's test; n = 4–5). B, effect of LPAR1 siRNA on amitriptyline-evoked GDNF mRNA expression. Cells were transfected with vehicle, LPAR1 siRNA, or Nega siRNA for 48 h and subsequently treated with 25 μm amitriptyline for 3 h. **, p < 0.01; +, p < 0.05; n.s., not statistically significant (Bonferroni's test; n = 6–16). C, the effect of LPAR antagonists on the amitriptyline-GDNF release. C6 cells were pretreatment with either AM966 (AM), Ki16425 (Ki), or H2L5186303 (H2L) for 0.5 h and subsequently treated with 50 μm amitriptyline for 24 h. **, p < 0.01; +, p < 0.05; ++, p < 0.01; n.s., not statistically significant (Bonferroni's test; n = 8–10). D, time-dependent effect of LPA on GDNF mRNA expression. Cells were treated with 100 nm LPA for the indicated period in hours. *, p < 0.05; **, p < 0.01 versus control (Bonferroni's test; n = 3–7). E, effect of LPAR-related inhibitors on LPA-evoked GDNF mRNA expression. Cells were pretreated with either PTX for 3 h, or AM, Ki, H2L, SU5402 (SU), or U0126 (U) for 0.5 h and subsequently treated with 100 nm LPA for 1 h. **, p < 0.01 versus control, and ++, p < 0.01 versus LPA alone (Bonferroni's test; n = 3–4). F and G, effect of LPAR antagonists on ERK1/2 phosphorylation and FRS2α phosphorylation evoked by either amitriptyline (F) or LPA (G). Cells were pretreated with AM, Ki, or H2L for 0.5 h and subsequently treated with either 25 μm amitriptyline for 5 min or 100 nm LPA for 2 min. Phosphorylated/total ERK1/2 and phosphorylated/total FRS2α were quantified by immunoblotting. Immunoblots from a representative experiment are shown on the left and quantitative data are shown on the right. *, p < 0.05; **, p < 0.01 versus control; and +, p < 0.05; ++, p < 0.01 versus amitriptyline or LPA alone (Bonferroni's test; n = 3–8).

