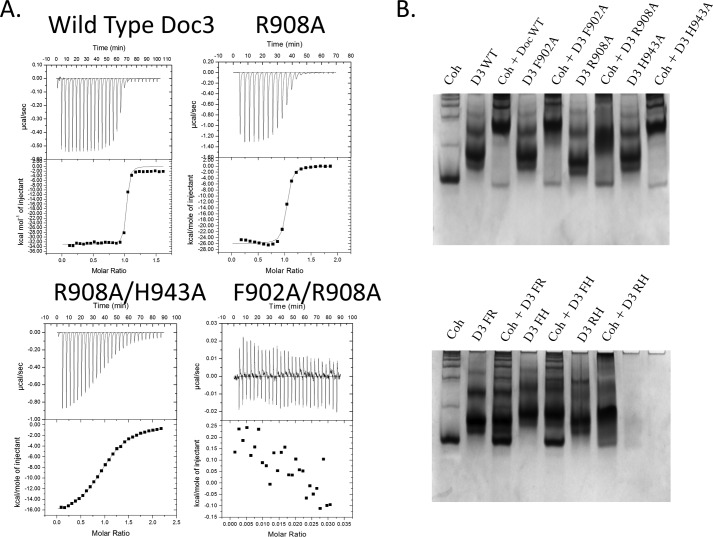
FIGURE 5.
Determination of Doc3 Phe-902, Arg-908, and His-943 importance for CohScaC recognition. A, representative binding isotherms of the interaction between CohScaC/Doc3, CohScaC/Doc3 R908A mutant, CohScaC/Doc3 R908A/H943A double mutant, and CohScaC/Doc3 F902A/R908A double mutant. The upper part of each panel shows the raw heats of binding, and the lower parts include the integrated heats after correction for heat of dilution. The curve represents the best fit to a single-site binding model. The corresponding thermodynamic parameters are shown in Table 3. B, non-denaturing gel electrophoretic analysis of CohScaC-Doc3 interaction. In the 1st lane, both gels were loaded with the cohesin (Coh). Adjacent lanes were loaded with the dockerin (D3) and with both the cohesin and dockerin modules together after a 60-min incubation at equimolar concentrations. The appearance of a band with a different migration pattern in lanes containing the complex represents a positive result (e.g. D3 WT), whereas a negative result (e.g. D3 FR) is given by the appearance of only the individual dockerin and cohesin bands. A faint cohesin band is seen even in the lanes where there is complex formation that results from excess cohesin probably due to not all the dockerin in solution being active.

