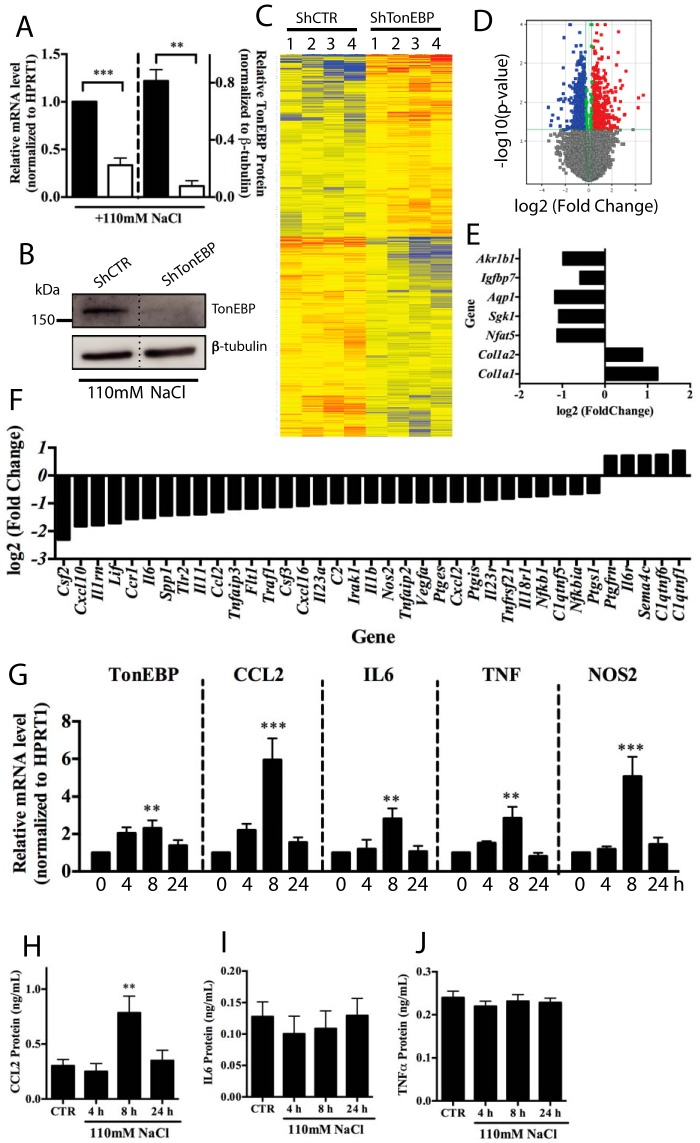
FIGURE 1.
RNA sequencing of TonEBP knockdown NP cells reveals regulation of pro-inflammatory transcripts. A and B, TonEBP mRNA and protein levels decrease after transduction with TonEBP-directed shRNA. C and D, heat map (C) and volcano plot (D) depicting differentially expressed genes between control and TonEBP-shRNA transduced NP cells. E, RNA sequencing of TonEBP-silenced samples confirms decreases in TonEBP (NFAT5), along with changes in positively regulated (Akr1b1, Igfbp7, Aqp1, and Sgk1) and negatively regulated (Col1a1 and Col1a2) transcriptional targets. Log 2 (-fold change) values are shown. F, log 2 (-fold change) values for inflammation-related transcripts that are differentially expressed between control and TonEBP knockdown. G, NP cells cultured under hypertonic conditions (110 mm NaCl added) up to 24 h show increased mRNA levels of TonEBP, CCL2, IL6, TNF, and NOS2 at 8 h after stimulus. H–J, protein levels of CCL2 (H), IL6 (I), and TNFα (J) cultured under hypertonic conditions for up to 24 h. CCL2 shows significant induction at 8 h following stimulation. Levels of IL6 and TNFα do not show any change. In B, one representative Western blot image is shown; lanes between those shown were removed from the image; knockdown experiments were repeated three independent times. Quantitative measurements represent mean ± S.E. of ≥3 biological replicates. *, p ≤ 0.05; **, p ≤ 0.01; ***, p ≤ 0.001; ****, p ≤ 0.0001.

