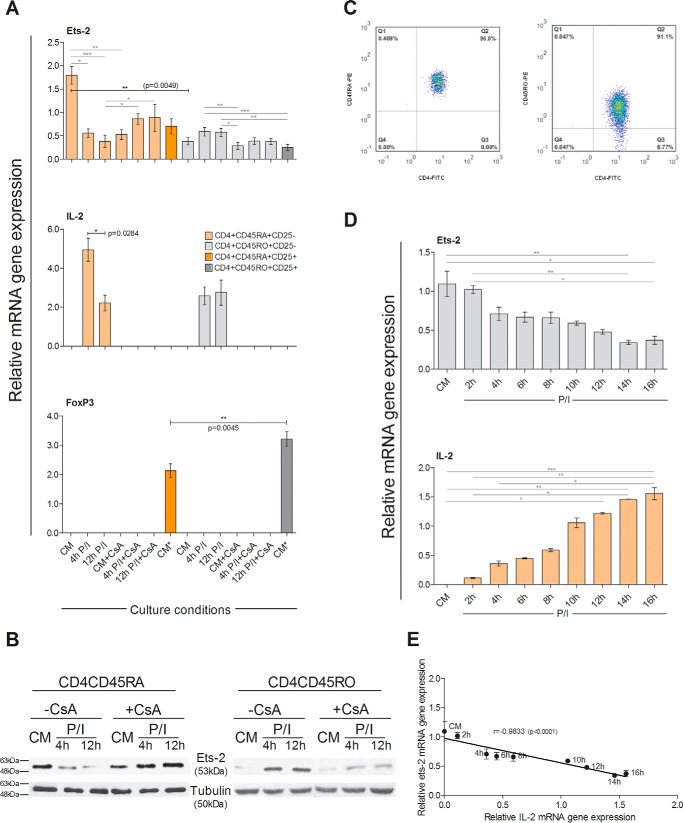
FIGURE 2.
Ets-2 and IL-2 mRNA synthesis in Th cells under different culture conditions and effect of CsA. A, Ets-2, IL-2 and Foxp3 mRNA levels were measured by real time PCR in naive Th cells (CD4CD45RA) and Tregs (CD4CD25) isolated from cord blood and in memory Th cells (CD4CD45RO) and Tregs (CD4CD45ROCD25) isolated from adult PBMCs. Naive and memory Th cells were cultured ±CsA in culture medium (CM) ± P/I for 4 or 12 h. Tregs isolated from cord blood or PBMCs were cultured in CM only. Reverse transcribed β2-m was used as an internal normalizer for all samples. B, Western blotting analysis of Ets-2 protein levels in CD4CD45RA and CD4CD45RO Th cells in CM or following a 4- or 12-h induction +P/I ±CsA. Tubulin protein levels were used as an internal control for equal loading. The results shown in A and B are representatives of three independent experiments that all yielded similar results. C, FACS analysis of the isolated naive and memory Th cells (Q2) used in A and B. D, kinetic analysis of Ets-2 and IL-2 mRNA expression in naive Th cells following mitogenic stimulation. Naive (CD4+CD45RA+CD25−) Th cells were isolated from cord blood by cell sorting. The enriched cell population (>95%) was cultured with P/I for 2–16 h, and Ets-2 and IL-2 mRNA expression was assayed with real time PCR at the times indicated using β2-m as an internal normalizer in each sample. The results shown are the mean values of three independent experiments; error bars represent S.D. Statistically significant differences are indicated by asterisks (*, p < 0.05; **, p < 0.01; ***, p < 0.001) and were compared with two-way ANOVA (more than two groups) or Student's t test (two groups) (*, p < 0.05; **, p < 0.005). E, there was a significant negative correlation between expression levels of Ets-2 mRNA and IL-2 mRNA in naive Th cells (Spearman's r = −0.9833, p < 0.0001).

