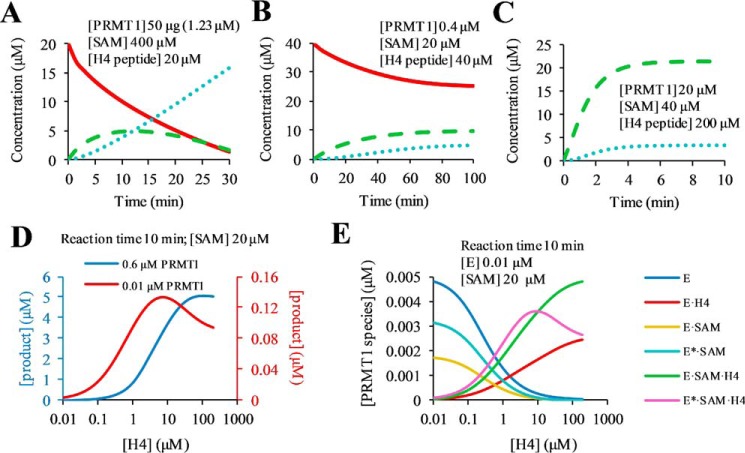
FIGURE 13.
Simulations of the methylation time course and steady-state kinetics. A–C, time-dependent concentration changes of H4 (red solid line), H4me1 (green dashed line), and H4me2a (blue dotted line) peptide are shown. The concentrations of PRMT1, SAM, and H4 peptide are set the same as in Ref. 32 for A, as in Ref. 25 for B, and as in Ref. 24 for C. D, simulation of steady-state product curves under 0.01 (red) and 0.6 (blue) μm PRMT1. E, generation of PRMT1 (E) species under 0.01–200 μm H4 peptide.

