
FIGURE 4.
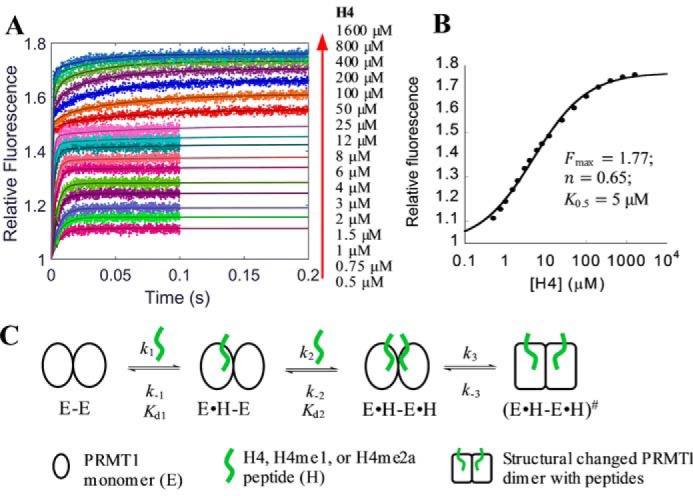
Formation of PRMT1-H4 complex. A, stopped-flow fluorescence data with fitting curves (solid lines) generated from global simulation based on the model shown in C. The fluorescence was acquired for 0.1 s for 0.5–12 μm peptide and 0.2 s for 25–1600 μm peptide. The fluorescence intensity of each signal trace was normalized with that of apo-PRMT1 as 1. B, plot of the steady-state fluorescence intensity in A versus peptide concentration, from which the maximum fluorescence intensity Fmax, the Hill coefficient n, and the concentration producing 50% occupancy of binding sites K0.5 were determined with Equation 10. C, proposed model of peptide binding with PRMT1.