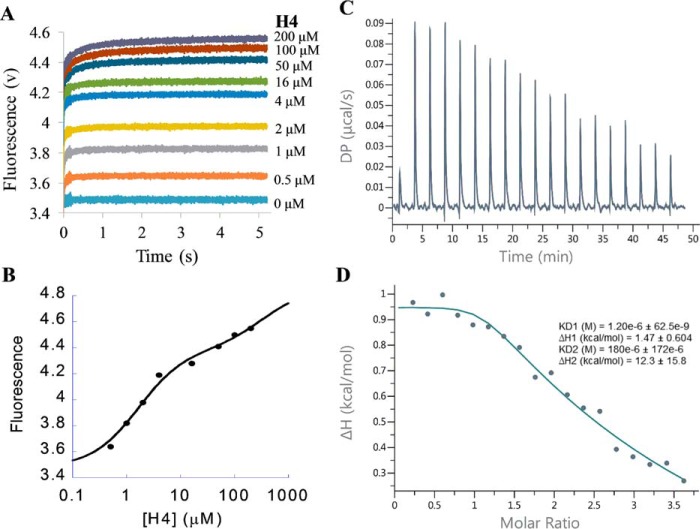
FIGURE 9.
Measurement of the binding of PRMT1-SAH mixture with H4 peptide. A, stopped-flow fluorescence of (E+C)+H assay of the PRMT1-SAH-H4 ternary complex formation. The total concentrations of PRMT1 and SAH in the final solution are 0.4 and 50 μm, respectively. According to the data from 0.5–4 μm H4, the signals increased fast and leveled up at 0.2 s. According to the data from 50–200 μm, there was another slow increase occurring at 0.2–5 s, probably caused by the second peptide binding with the dimer of the PRMT1-SAH complex. B, plot of the steady-state fluorescence intensity in A versus peptide concentration. The data show the biphasic pattern. C and D, ITC titration curve (C) and binding isotherm (D) of the PRMT1-SAH mixture (24.2 μm for PRMT1 dimer and 200 μm for SAH, in cell) binding with the H4-SAH mixture (450 μm for H4 peptide and 200 μm for SAH, in syringe). The data were fitted with the sequential binding model.

