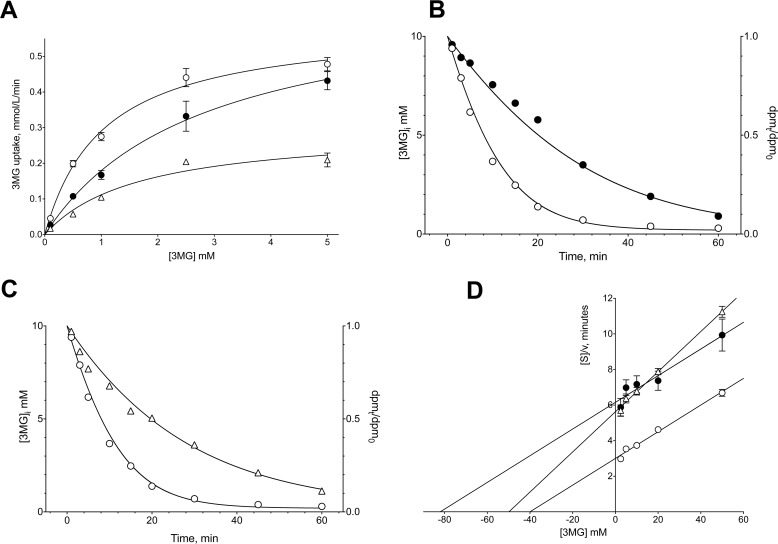
FIGURE 3.
Effects of WZB117 and CB on Michaelis-Menten kinetics of zero-trans 3MG uptake (A), zero-trans 3MG exit (B and C), and equilibrium exchange 3MG uptake (D). Results are shown for control cells (○), WZB117-treated cells (●), and for CB-treated cells (▵). Each data point is the mean ± S.E. of three duplicate measurements. A, ordinate: 3MG uptake in mmol/liter of cell water/min. Abscissa: [3MG]o in mm. Curves drawn through the points were computed by nonlinear regression assuming Michaelis-Menten uptake kinetics (Equation 2) and have the following results: control cells (○),Vmax = 0.59 ± 0.03 mmol/liter of cell water/min, Km(app) = 1.05 ± 0.16 mm, R2 = 0.992, standard error of regression = 0.018 mmol/liter of cell water/min; WZB117 treatment (●): Vmax = 0.68 ± 0.04 mmol/liter of cell water/min, Km(app) = 2.77 ± 0.35 mm, R2 = 0.997, standard error of regression = 0.018 mmol/liter of cell water/min; CB treatment (▵): Vmax = 0.29 ± 0.05 mmol/liter of cell water/min, Km(app) = 1.67 ± 0.63 mm, R2 = 0.966, standard error of regression = 0.010 mmol/liter of cell water/min. B and C, ordinates: [3MG]i in mmol/liter of cell water. Abscissa: time In minutes. Curves drawn through the points were computed by nonlinear regression and numerical integration assuming Michaelis-Menten exit kinetics and have the following results: Control cells (○): Vmax = 2 mmol/liter of cell water/min, Km(app) = 15 mm; WZB117 treatment (●): Vmax = 0.8 mmol/liter of cell water/min, Km(app) = 15 mm; CB treatment (▵): Vmax = 2 mmol/liter of cell water/min, Km(app) = 47 mm. D, Hanes-Woolf plot of equilibrium exchange transport. Ordinate: [3MG]/rate of equilibrium exchange 3MG uptake in minutes. Abscissa: intracellular and extracellular [3MG] in mm. Lines drawn through the points were computed by nonlinear regression assuming that each line is described by Equation 3. The results are: control cells (○): Vmax = 13.39 ± 0.79 mmol/liter of cell water/min, Km(app) = 40.25 ± 3.57 mm, R2 = 0.990, standard error of regression = 0.17 min; WZB117 treatment (●): Vmax = 13.36 ± 2.02 mmol/liter of cell water/min, Km(app) = 82.25 ± 15.30 mm, R2 = 0.936, standard error of regression = 0.43 min; CB treatment (▵): Vmax = 8.87 ± 0.33 mmol/liter of cell water/min, Km(app) = 49.85 ± 2.55 mm, R2 = 0.996, standard error of regression = 0.16 min.

