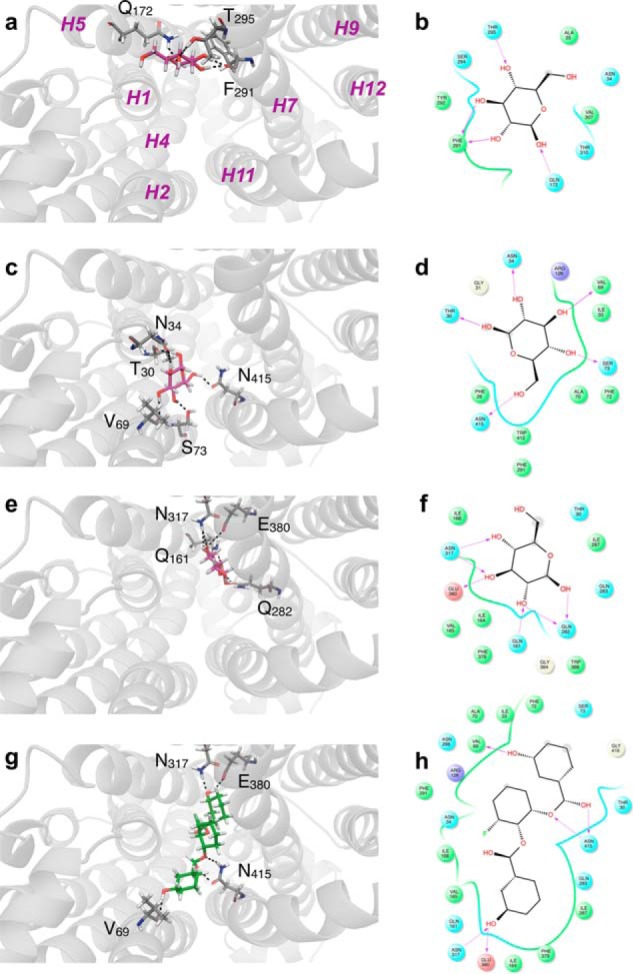
FIGURE 8.

β-d-Glucose (a–f) and WZB117 (g and h) binding to hm-GLUT1-e2. The perspective is looking into the exofacial cavity of hm-GLUT1-e2 from the interstitium. The identities of several membrane spanning α helices (H1, H2, H4, H5, H7, H9, H11, and H12) are indicated in magenta in a. β-d-Glucose (in red) is shown docked to the peripheral (a and b), intermediate (c and d), and core (e and f) sites. Computed ΔG for ligand binding: peripheral, d-Glc binding site ΔG = −5.1 kcal/mol; intermediate d-Glc binding site ΔG = −5.1 kcal/mol; core binding site = −4.9 kcal/mol. WZB117 is shown in green (g), and its docking site overlaps with intermediate and core β-d-Glc binding sites. ΔG for WZB117 binding = −8.22 kcal/mol. Note that two additional configurations of WZB117-hm-GLUT1-e2 interactions were observed: one in which WZB117 interacts with and spans peripheral and core β-d-glucose binding sites (ΔG = −7.37 kcal/mol) and a second where WZB117interacts only with the peripheral and intermediate β-d-glucose binding sites (ΔG = −6.74 kcal/mol). Binding is shown as two representations: 1) three-dimensional in which GLUT1 is represented in transparent schematic format, Glc and WZB117 is in stick format, and H-bonds are represented as dashed lines (a, c, e, and g); 2) two-dimensional format in which Glc and WZB117 are shown as two-dimensional structures, coordinating GLUT1 residues are shown as circles, GLUT1 backbones are shown as ribbons, solvent-exposed regions of β-d-Glc and WZB117 are indicated by gray-shaded circles, and H-bonds and their directionality are represented as red arrows (b, d, f, and h).
