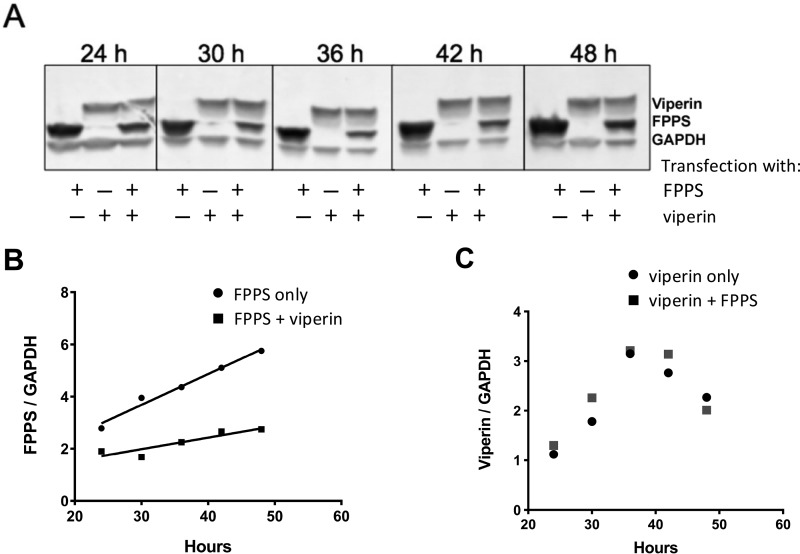
FIGURE 3.
Reduction of cellular FPPS levels by viperin in co-transfected HEK293T cells. A, Western blotting analysis of viperin and FPPS expression levels as a function of time after transfection. GAPDH was used as the loading control. B, quantification of intracellular levels of FPPS relative to GAPDH as a function of time in the absence and presence of co-expressed viperin. C, quantification of intracellular levels of viperin relative to GAPDH as a function of time in the absence and presence of co-expressed FPPS.

