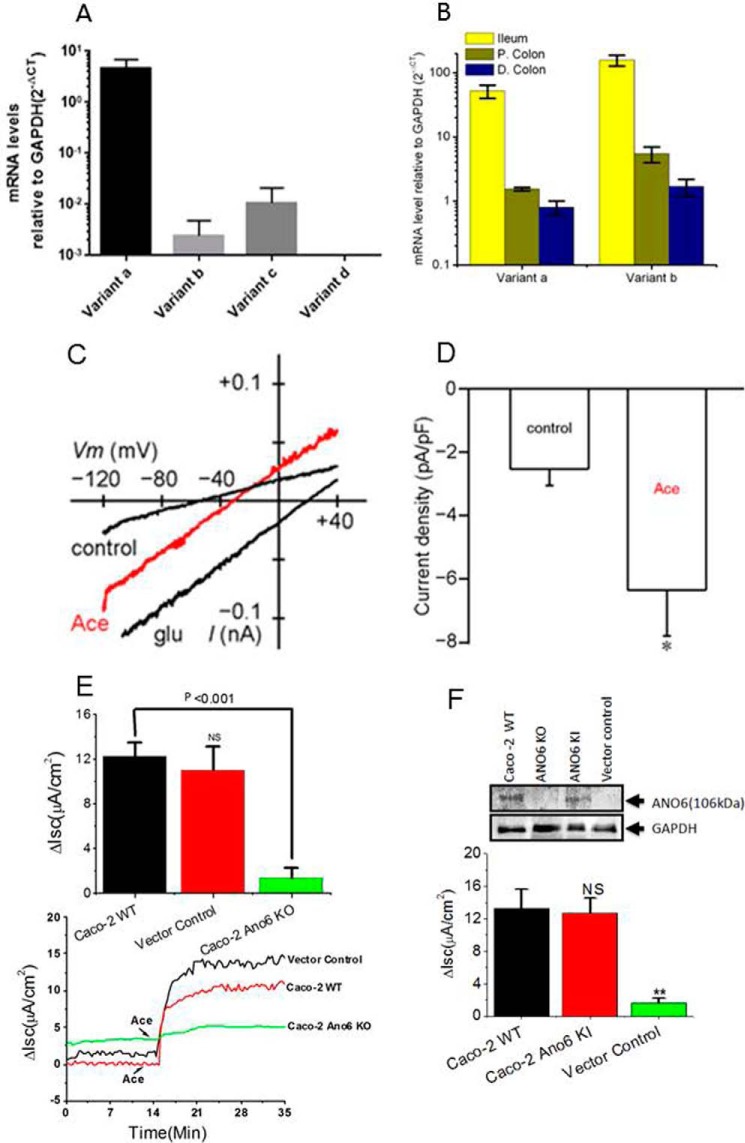
FIGURE 9.
Quantitative mRNA expression and activation of ANO6 whole-cell current in Caco-2 cells. A, relative expression (normalized by expression of GAPDH) of ANO6 variants in Caco-2 cells; B, mouse intestinal tissues in log scale. Data are means ± S.E. from triplicate experiments. C, whole-cell current response to Ace showing representative current-voltage relationship with gramicidin-perforated patch recording in Caco-2 cells. D, summary graph of current amplitude in response to Ace stimulation. * indicates significant difference at p < 0.05 compared with control (paired t test). E, knocking out of ANO6 mostly abolished Ace-stimulated Isc. Shown are representative time courses on the effects of Ace on Isc in WT, vector control, and ANO6 KO Caco-2 cells (bottom panel); top panel shows the summary of the data from four such monolayers. Values are means ± S.E. F, rescue experiments for ANO6 in Caco-2 cells by re-expression of ANO6 using retroviral expression system described under “Experimental Procedures.” Top panel, Western blotting analysis of proteins in total lysate of wild type, ANO6 KO, ANO6 KI, and in vector control cells. Anti-GAPDH was used as loading control. Bottom panel, summary of the data on Ace-stimulated Isc in ANO6 KO and ANO6 KI cells with WT and vector control. ** indicates significant difference at p < 0.001compared with WT or vector control (paired t test). NS, statistically not significant.

