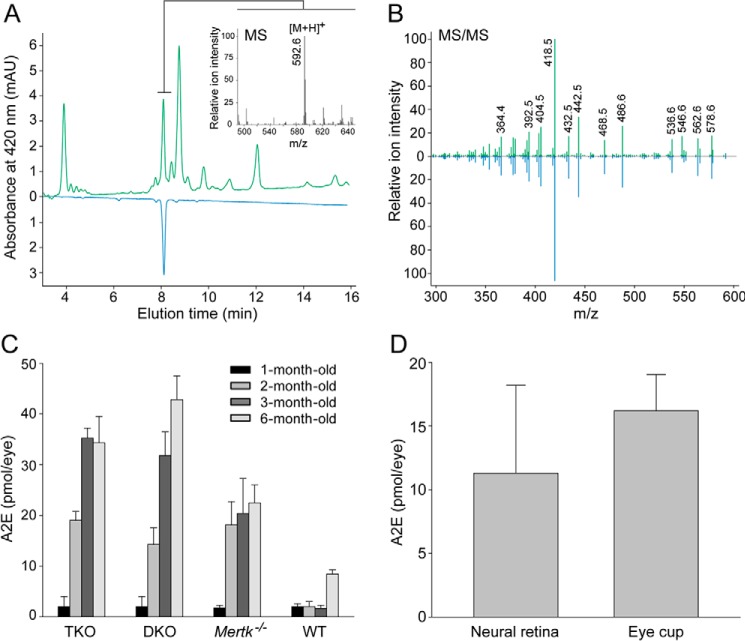
FIGURE 6.
Quantification of A2E in mouse eyes. Analyses were done with a synthetic A2E standard and HPLC coupled to MS. A, chromatographic separation of organic compounds extracted from the eyes of 6-month-old Mertk−/−Abca4−/−Rdh8−/− mice (green trace). The peak corresponding to A2E was identified based on its retention time (blue trace), molecular mass (inset), and MS2 fragmentation pattern (B), all of which were identical to an A2E synthetic standard. C, amounts of A2E in the eyes of Mertk−/−Abca4−/−Rdh8−/− (TKO), Abca4−/−Rdh8−/− (DKO), Mertk−/−, and WT mice at 1–3 and 6 months of age were quantified by HPLC. Bars indicate S.D. n ≥ 3 animals. D, neural retina was isolated from the eyes of 6-month-old Mertk−/−Abca4−/−Rdh8−/− mice, and A2E quantification of the neural retina and the remaining eyecup was carried out. Bars indicate S.D. n ≥ 3 animals. mAU, milliabsorbance unit.

