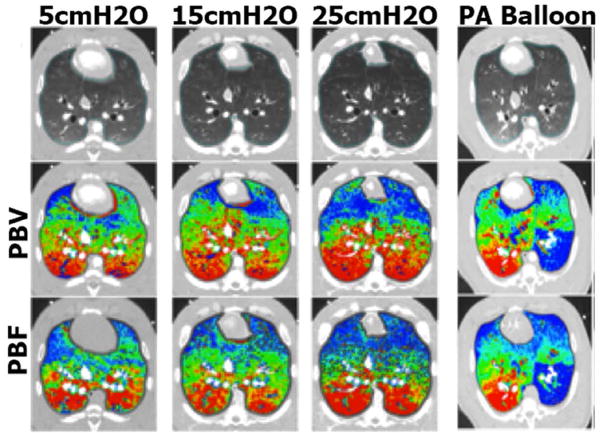
Figure 3.
Gray-scale (top row), PBV (middle row), and PBF (lower row) MDCT scans. (Columns 1–3) Color map comparison of CT-derived PBF and PBV from pig imaged at 3 different lung volumes, used to achieve a range of pulmonary perfusion values. (Column 4) Color map comparison of CT-derived PBF (dynamic axial scanning) and PBV (dual energy spiral scanning) from pig studied with a balloon partially inflated in a left lower lobe pulmonary artery. Color coding is the same for each condition: percent of total PBV or PBV with low values in blue and high values in red. Modified from 72.

