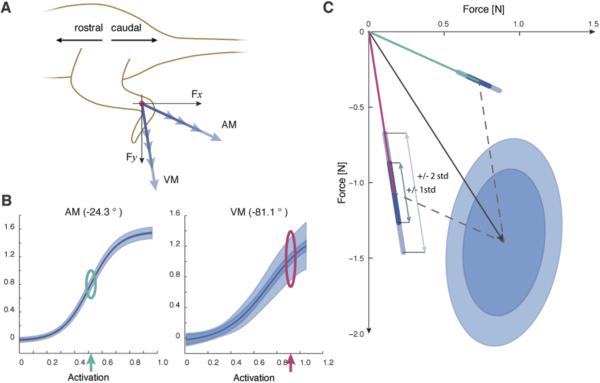
Fig. 3.
A) Depiction of experimental setup and force vector orientations. All forces were measured in the animal's sagittal plane. For illustrative purposes hypothetical force vectors are shown for adductor magnus (AM) and vastus medialis (VM). The orientation of each muscle's force vector is an angle measured relative to horizontal. B) Experimentally obtained recruitment curves for rectus adductor magnus and vastus medialis illustrate the variability in predicted forces. Displayed are the maximum likelihood values (solid lines), model uncertainty (+/−1 standard deviation) and motor noise (+/−1 standard deviation). C) An example force vector, demonstrating how individual muscle forces and uncertainty (depicted at the activation levels marked with the green and magenta arrows from B) are used to make predictions for forces resultant force prediction.

