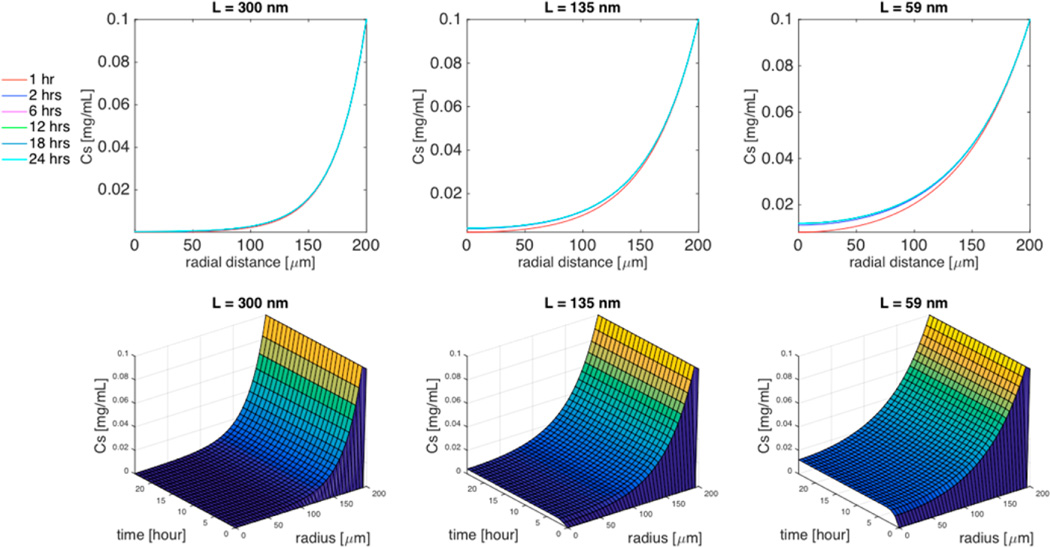
Figure 7.
Simulation of the effect of aspect ratio (L/d = 300/18, L/d = 135/18, or L/d = 59/18) on TMV-PEG concentration distribution within the spheroid. Top 3 panels are 2D plots of the concentration of TMV formulations as a function of the radial distance within the spheroid for specific time interval (1 h, 2 h, 6 h, 12 h, 18 h, 24 h), and the bottom 3 panels are the corresponding 3D plots of the concentration of TMV as a function of both time and radial distance. Cell density ϕ = 0.5, spheroid radius R = 200 µm, TMV concentration in the surrounding medium CM = 0.1 mg/mL.

