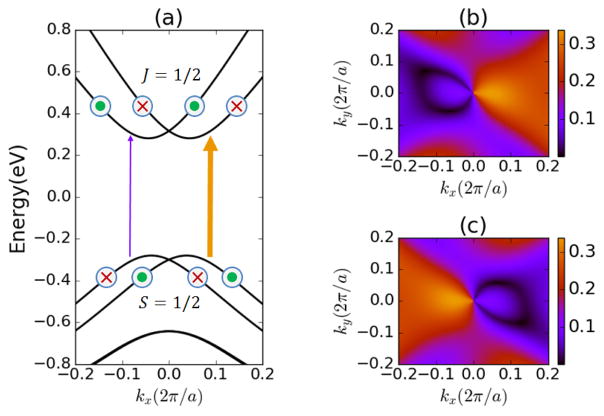
FIG. 2.
(a) depicts the Rashba-type band structure of CH3NH3PbI3 along kx(ky = 0, kz = 0). For S = 1/2 valence bands, circles with cross (red) and dot (green) indicate the spin orientations pointing into and out of the paper, respectively. For J = 1/2 conduction bands, the labeled orientations correspond to the total angular momenta. The arrows with different thickness represent the asymmetric transition rates at k and −k for right circularly polarized light. (b) and (c) show matrix elements for transitions between highest valence band and lowest conduction band. + and − correspond to right and left circularly polarized light, respectively.

