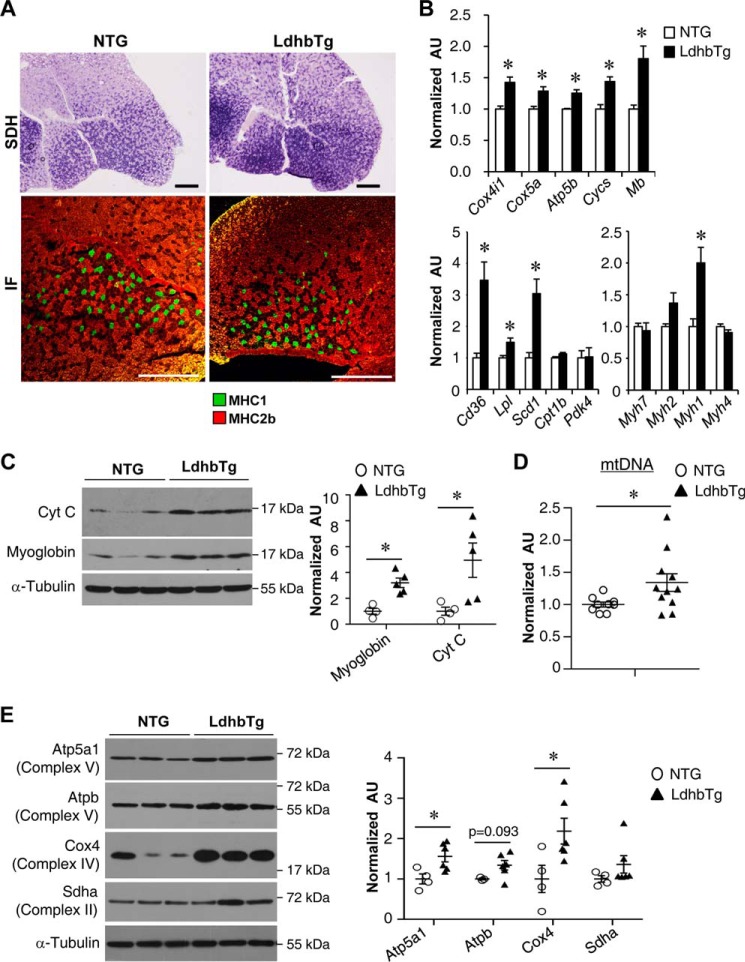
FIGURE 5.
MCK-Ldhb muscle is reprogrammed for increased capacity for mitochondrial oxidation. A, top row, cross-section of the GC muscle from a 3-month-old female NTG and MCK-Ldhb (LE) stained for SDH. Bottom row, representative MHC immunofluorescence (IF) in the GC muscles of the indicated genotypes. Green, MHC1; red, MHC2b (n = 3–8 mice/group). Scale bars, 500 μm. B, expression of genes involved in mitochondrial oxidation, fuel metabolism, and contractile myosin isoforms (qRT-PCR) in GC muscle from the NTG and MCK-Ldhb (LE) mice (n = 4–6 mice/group). C, left panel, representative Western blotting analysis performed with WV muscle total protein extracts prepared from the NTG and MCK-Ldhb (LE) mice using cytochrome c, myoglobin, and α-tubulin (control) antibodies. Right panel, quantification of the myoglobin/tubulin and cytochrome c/tubulin signal ratios normalized ( = 1.0) to the NTG control (n = 4–5 mice/group). D, results of qPCR to determine mitochondrial DNA levels in GC muscle of the MCK-Ldhb (LE) mice (n = 9–11 mice/group). E, left panel, representative Western blotting analysis performed with WV muscle total protein extracts prepared from the NTG and MCK-Ldhb (LE) mice using Atp5a1, Atpb, Cox4, Sdha, and α-tubulin (control) antibodies. Right panel, quantification of the Western blot shown in the left panel. Atp5a1/tubulin, Atpb/tubulin, Cox4/tubulin, and Sdha/tubulin signal ratios were normalized (1.0) to the NTG control (n = 3–6 mice/group). *, p < 0.05 versus NTG. All values represent the means ± S.E.

