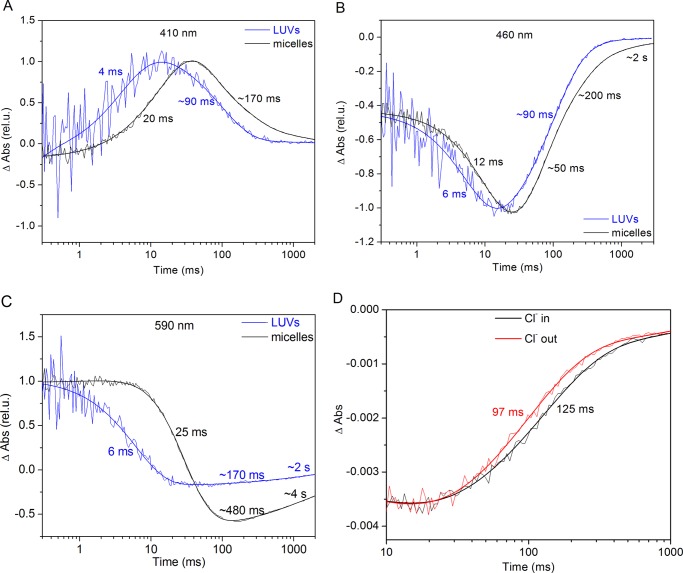
FIGURE 3.
Flash photolysis measurements of GtACR1 in LUVs and micelles. A–C, laser flash-induced absorption (Abs) changes of GtACR1 in LUVs and DDM monitored at three representing wavelengths: 410 (A), 460 (B), and 590 nm (C). The blue lines represent GtACR1-LUVs, and the black lines represent GtACR1 in DDM. The fitted lines and rates are shown on each curve. rel. u., relative units. D, laser flash-induced absorption changes of GtACR1-LUVs monitored at 500 nm with Cl− inside and Cl− outside are shown in black and red, respectively.

