FIGURE 9.
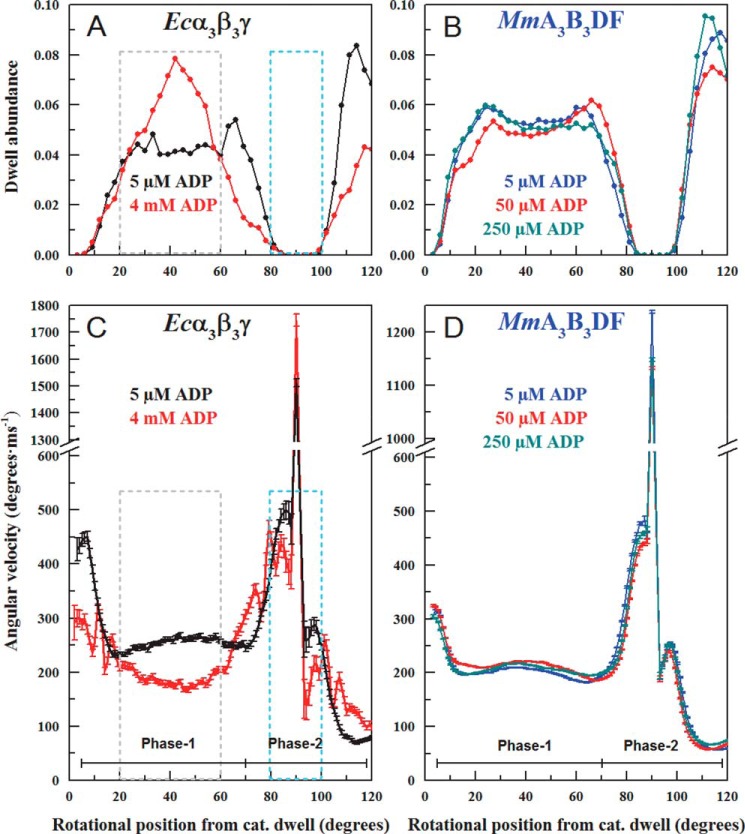
Effects of elevated ADP concentrations on the average angular velocity profiles. A, dwell abundance as a function of rotational position during the power stroke of Ecα3β3γ at 1 mm MgATP in the absence (black) versus the presence of 4 mm MgADP (red). B, dwell abundance as a function of rotational position during the power stroke of the MmA3B3DF complex at 1 mm MgATP in the absence (blue) versus the presence of 50 μm (red) and 250 μm (orange) MgADP. C, average angular velocity of the power stroke as a function of rotational position of EcF1 at 1 mm ATP in the absence (black) versus the presence (red) of 4 mm MgADP. D, average angular velocity of the power stroke as a function of rotational position of the MmA3B3DF complex at 1 mm MgATP (blue) in the absence (blue) versus the presence of 50 μm (red) and 250 μm (orange) MgADP.

