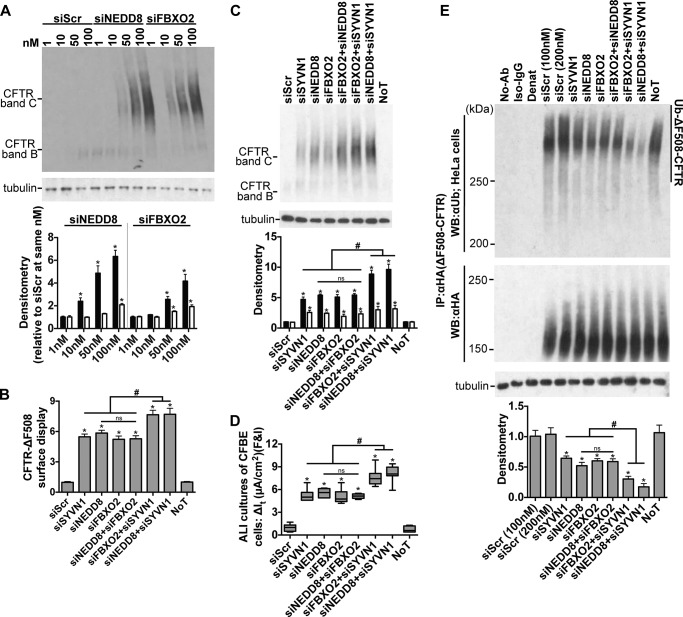
FIGURE 6.
NEDD8 and FBXO2 exhibit overlapping action in regulating ΔF508-CFTR biosynthesis. A, representative immunoblots depicting rescue of ΔF508-CFTR maturation in CFBE cells. Protein was harvested 72 h post-treatment. Densitometry represents -fold increase of ΔF508-CFTR bands C and B relative to siScr in CFBE cells. n = 3. B, surface display of ΔF508-CFTR in HeLa cells measured by cell surface ELISA 72 h after the indicated treatments. -Fold increase and significance are relative to siScr transfection. n = 18. C, representative immunoblot depicting ΔF508-CFTR expression in CFBE cells. Protein was harvested 72 h post-treatment. Densitometry represents -fold increase of ΔF508-CFTR bands C and B relative to siScr in CFBE cells. n = 4. D, change in It in response to forskolin and IBMX (F&I) treatment in polarized ALI cultures of CFBE cells. n = 6. E, ΔF508-CFTR ubiquitination measured 72 h after the indicated treatments. CFTR was immunoprecipitated with anti-HA antibody, and ubiquitin was detected with anti-ubiquitin antibody. Densitometry is relative to siScr. n = 4. A, B, C, and E represent mean with error bars indicating S.E. D, box and whisker plot (minimum-maximum) represents median. Statistical significance was determined by one-way ANOVA with Holm-Bonferroni correction: *, p < 0.01 (relative to siScr); #, p < 0.01; ns, not significant. WB, Western blotting; Ab, antibody; NoT, no treatment; Ub, ubiquitin; Denat, denatured.

