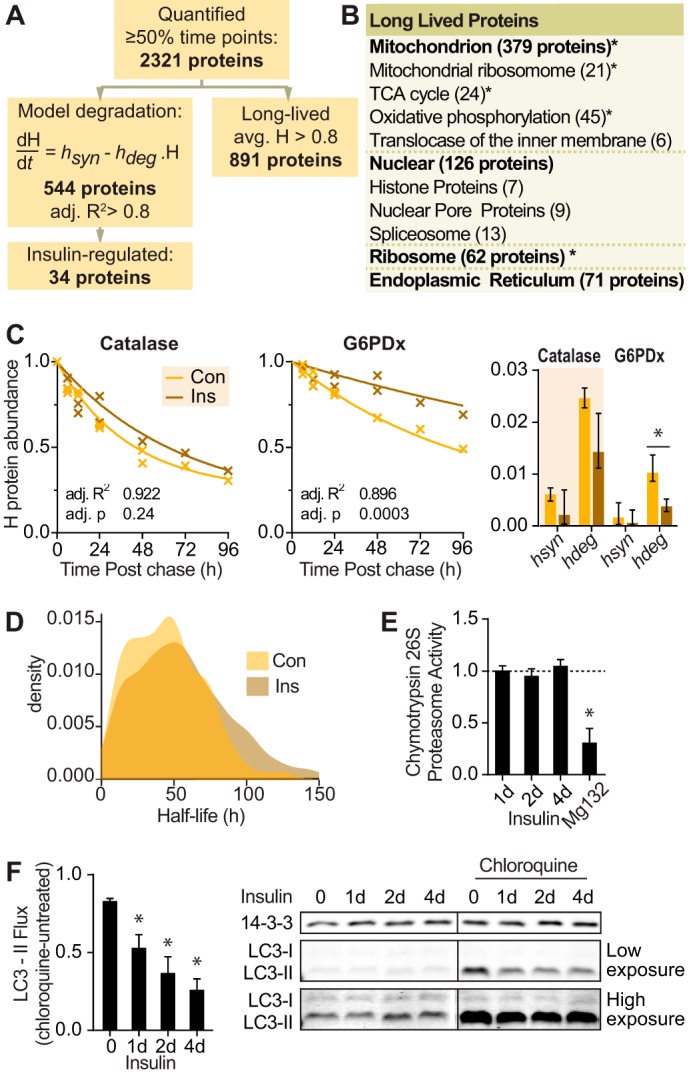
FIGURE 3.

Insulin minimally affects protein degradation despite suppression of autophagy. A, number of proteins that were quantified, curve fitted, insulin-regulated, or long lived in protein degradation data. B, gene ontology terms of long lived proteins from proteomic data with number of proteins in each category in parentheses. Significantly enriched gene ontology terms are indicated (*, p < 0.05). TCA, tricarboxylic acid. C, graph of abundance of representative heavy labeled proteins in control (Con) and insulin (Ins)-treated cells over the time course. The line indicates the best fit degradation curve. The bar graph indicates mean and S.D. of the curve parameters hdeg for degradation and hsyn for reincorporation of heavy amino acids into proteins. Statistics were performed on a linearized model as described under “Experimental Procedures” (*, p < 0.05). D, density graph of proteome half-lives calculated from protein degradation data. E, 3T3-L1 adipocytes were treated with insulin for the indicated times or MG132 for 2 h. Chymotrypsin activity of 26S proteasome was quantified and normalized to untreated cells (indicated by the dotted line) (n = 4; error bars represent S.E.; one-sample t test; *, p < 0.05). F, 3T3-L1 adipocytes were treated with insulin for the indicated days (d) and/or 400 μm chloroquine for 15 min. Cell lysates were immunoblotted with the indicated antibodies. Vertical lines on immunoblots indicate where the blot was spliced. Immunoblots were quantified, and LC3-II was normalized to the 14-3-3 loading control. LC3-II flux was calculated as the difference of LC3-II with chloroquine minus without chloroquine for each time point (n = 5; error bars represent S.E.; one-sample t test; *, p < 0.05).
