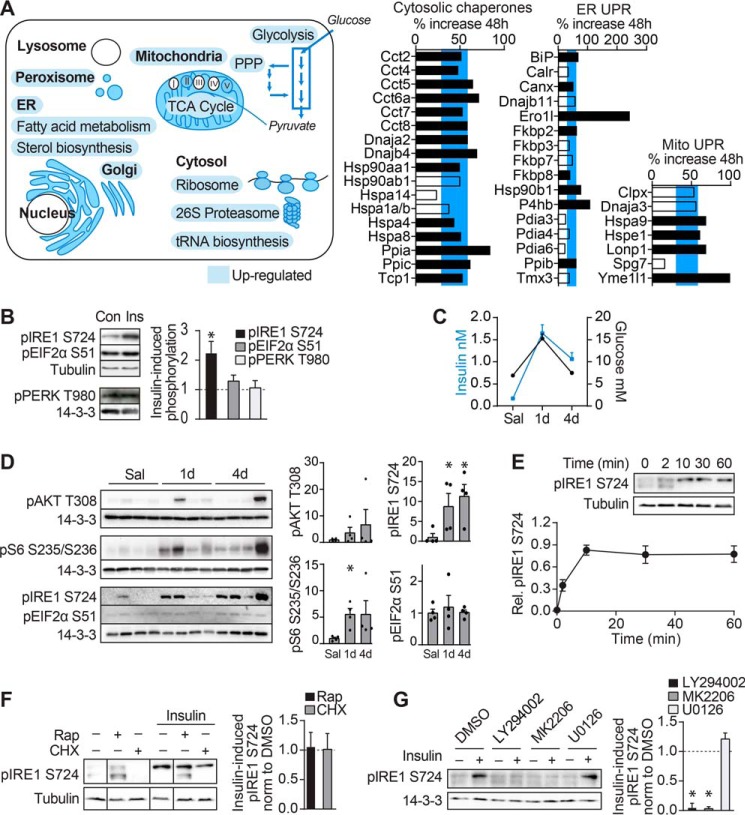
FIGURE 4.
Insulin coordinates synthesis of proteins across multiple compartments with proteostasis network. A, gene ontology of newly made proteins significantly increased in response to insulin are highlighted in blue and depicted in the illustration of a cell. TCA, tricarboxylic acid; PPP, pentose phosphate pathway. Bar graphs depict the percent increase in abundance of ER UPR, mitochondrial (Mito) UPR, or cytosolic chaperone proteins synthesized after 48-h incubation with insulin compared with control. Black bars indicate significantly insulin-regulated proteins. The blue horizontal bar indicates the interquartile range of the percent increase in insulin-regulated proteins. B, 3T3-L1 adipocytes were treated with insulin (Ins) for 24 h, and cell lysates were immunoblotted for the indicated proteins. Con, control. Immunoblots were quantified and normalized to loading control and untreated samples (n = 5 for phosphorylated IRE1 (pIRE1) and EIF2α (pEIF2α); n = 3 for phosphorylated PERK (pPERK); error bars represent S.E.; one-sample t test; *, p < 0.05). C and D, rats were cannulated and infused with 40 mg/kg/min glucose for the indicated periods or saline (Sal) for 4 days (d). C, plasma glucose and insulin levels are reproduced from Laybutt et al. (46). D, adipose tissue of rats was immunoblotted for the indicated proteins. Immunoblots were quantified and normalized to loading control and saline samples (n = 4; error bars represent S.E.; two-sample t test; *, p < 0.05). E, 3T3-L1 adipocytes were serum-starved for 1.5 h and treated with insulin for the indicated times. Cell lysates were immunoblotted with the indicated antibodies. Immunoblots were quantified and normalized to 14-3-3. Data were scaled so that basal is set to 0, and the maximal response set to 1 (n = 4; error bars represent S.E.; one-sample t test; *, p < 0.05). F and G, 3T3-L1 adipocytes were serum-starved for 1.5 h and treated with the indicated inhibitors for 30 min followed by insulin for 30 min. Cell lysates were immunoblotted for the indicated proteins. Vertical lines on the immunoblots indicate where the blot was spliced. Immunoblots were quantified and normalized (norm) to 14-3-3. Insulin-stimulated phosphorylated IRE1 is expressed as -fold change relative to DMSO-treated samples (indicated by the dotted line) (F, n = 4; G, n = 5; error bars represent S.E.; one-sample t test; *, p < 0.05). Rap, rapamycin; CHX, cycloheximide.

