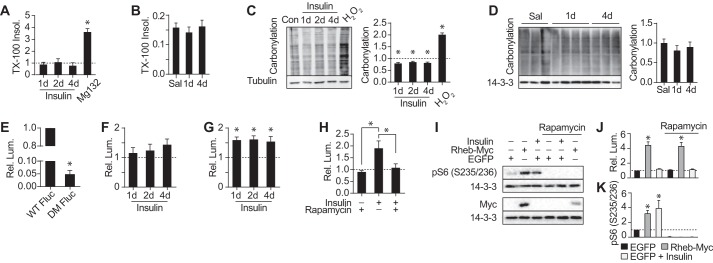
FIGURE 5.
Insulin preserves protein folding. A, 3T3-L1 adipocytes were treated with insulin for the indicated periods or MG132 for 24 h. Triton X-100-insoluble protein was measured and normalized to untreated cells (indicated by the dotted line) (n = 3; error bars represent S.E.; one-sample t test; *, p < 0.05). B, Triton X-100-insoluble protein relative to total protein was measured in adipose tissue of rats (Fig. 4C) (saline (Sal), n = 6; 1-day (d) glucose, n = 8; 4-day glucose, n = 7; error bars represent S.E.; two-sample t test; *, p < 0.05). C, 3T3-L1 adipocytes were treated with insulin for the indicated periods or H2O2 for 30 min. Carbonylation was measured and normalized to untreated cells (n = 3; error bars represent S.E.; one-sample t test; *, p < 0.05). D, carbonylation was measured in rats (Fig. 4C) (saline, n = 6; 1-day glucose, n = 8; 4-day glucose, n = 7; error bars represent S.E.; two-sample t test; *, p < 0.05). E, 3T3-L1 adipocytes stably expressing WT Fluc or DM Fluc were assayed for luminescence. Luminescence (Lum.) was normalized to cells expressing WT Fluc (n = 4; error bars represent S.E.; one-sample t test; *, p < 0.05). F and G, 3T3-L1 adipocytes stably expressing WT Fluc (F) or DM Fluc (G) were treated with insulin for the indicated periods and assayed for luminescence. Luminescence was normalized to untreated cells (indicated by the dotted line) (F, n = 4; G, n = 6; error bars represent S.E.; one-sample t test; *, p < 0.05). H, 3T3-L1 adipocytes stably expressing DM Fluc were treated with insulin and/or rapamycin for 24 h and assayed for luminescence. Luminescence was normalized to untreated cells (indicated by the dotted line) (n = 3; error bars represent S.E.; one-way analysis of variance; *, p < 0.05). I–K, HEK293 cells were transiently co-transfected with WT Fluc and either enhanced GFP (EGFP) or Rheb-Myc and treated with insulin and/or rapamycin for 24 h. Lysates were immunoblotted with the indicated antibodies (I), quantified, and normalized to 14-3-3 and untreated sample expressing enhanced GFP (indicated by the dotted line) (J) (n = 3; error bars represent S.E.; one-sample t test; *, p < 0.05). Luminescence was measured in separate cells and normalized to untreated sample expressing enhanced GFP (K) (n = 4; error bars represent S.E.; one-sample t test; *, p < 0.05). pS6, phospho-S6.

