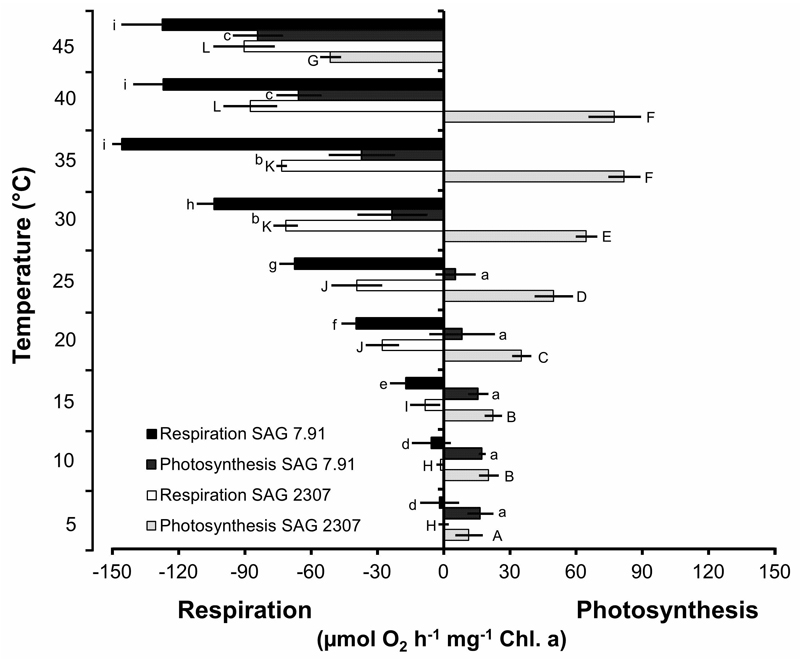
Fig. 7.
Net photosynthetic oxygen production and respiratory oxygen consumption in µmol O2 h-1 mg-1 Chl a measured at 200 µmol photons m-2 s-1 PAR as function of increasing temperatures in the two studied strains of Klebsormidium flaccidum (n = 4, mean value ± SD). SAG 2307: terrestrial isolate; SAG 7.91: freshwater isolate. Significances among the treatments were calculated by one-way ANOVA (P < 0.01). Different letters represent significant differences among the temperatures as revealed by Tukey’s post hoc test.

