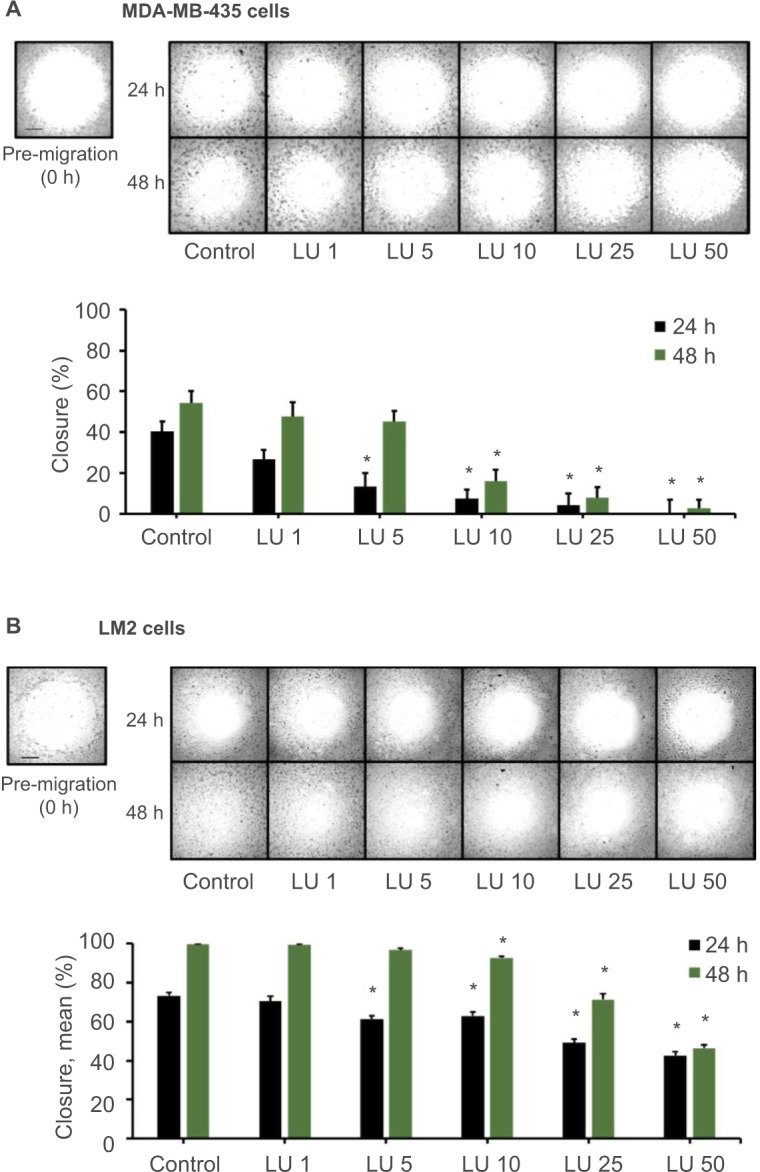
Figure 3.

LU inhibits migration of TNBC cells in vitro.
Notes: MDA-MB-435 cells (A) or MDA-MB-231 (4175) LM2 cells (B) (4 × 10⁴ cells/well) were plated in a 96-well migration assay plate and subjected to cell migration assays in the presence of vehicle control or varying concentrations of LU (1–50 µM) for 48 hours. Pictures were taken upon treatment (0 hour; pre-migration) and after 24 and 48 hours. Representative images (top) demonstrate LU-mediated inhibition of migration over 2 days. Bar graph (bottom) quantitates inhibition of cell migration; data represent mean ± SEM (n = 8). (A) *Significantly different compared with controls (P < 0.05, ANOVA). (B) *Significantly different compared with controls (24 hours, P < 0.05; ANOVA; 48 hours, P < 0.05; ANOVA on ranks). Scale bar, 500 µm.
Abbreviations: ANOVA, analysis of variance; h, hours; LU, luteolin; SEM, standard error of the mean; TNBC, triple-negative breast cancer.
