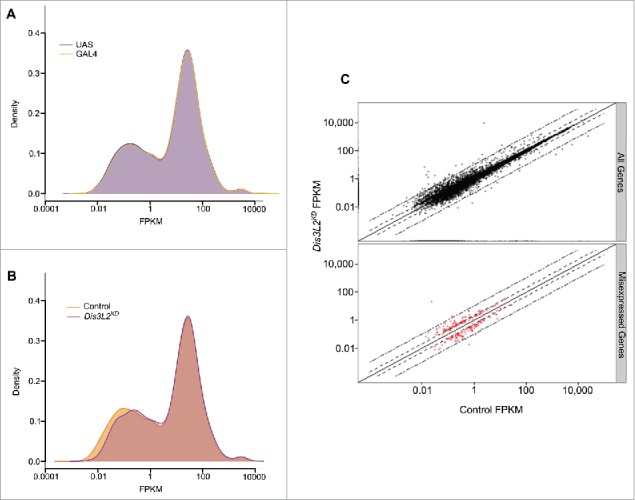
Figure 4.

dis3L2 knockdown largely affects transcripts expressed at low levels. (A) Kernel density plot comparing the overall gene expression profiles of the 2 parental controls (UAS = ;UAS-dis3L2RNAi; , GAL4 = ;;69B-GAL4). (B) Kernel density plot comparing dis3L2 knockdown (Dis3L2KD = ;UAS-dis3L2RNAi/+ ; 69B-GAL4/+) to the grouped control (Control =;UAS-dis3L2RNAi; and ; 69B-GAL4). Knockdown of dis3L2 results in a general shift in expression of the transcripts normally expressed at low levels to a level of higher expression. The moderately and highly expressed transcripts show less variation. (C) Scatter plots showing the fold changes between control and Dis3L2KD samples. All detected transcripts are shown in the top panel (black) while consistently misexpressed transcripts red are represented in the bottom panel. Dashed lines represent ± 2 fold changes whilst dot-dashed lines represent ± 10 fold changes.
