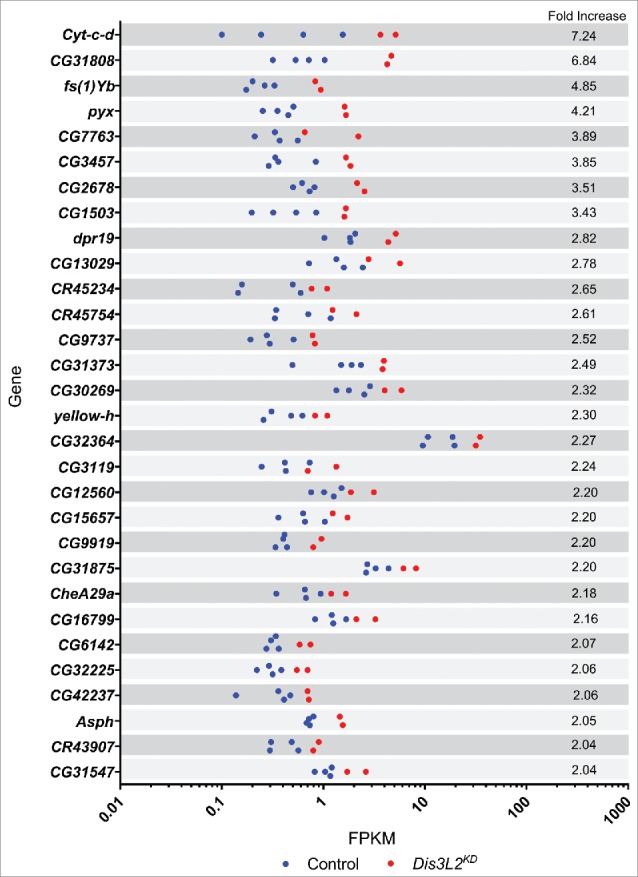
Figure 5.

Top 30 upregulated genes. Graphical representation of the replicate consistency for the 30 transcripts showing the greatest upregulation in dis3L2 knockdown discs with an average FPKM of more than 0.3. Knockdown replicates (Dis3L2KD) shown in red while control replicates are shown in blue.
