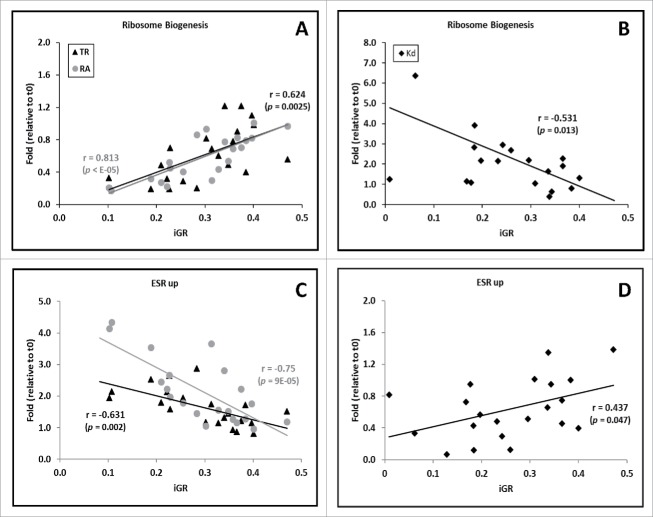
Figure 3.
Correlation between mRNA turnover with the predicted yeast growth rate during stress responses for some selected gene groups. These analyses are identical to those in Fig. 2, but use only selected groups of functionally related genes. By way of example, we show here some groups analyzed in a previous work15 for non-osmotic stresses: Ribosome Biogenesis (A, B) and ESR-induced genes (C, D). The trends for those groups in [mRNA] (RA in graphs) are to increase (RiBi) or decrease (ESR-up). These trends were expected because the iGR calculation is, in part, based on part of their genes. Unlike previous work under steady-state conditions, these changes are due not only to parallel trends in TR, but also to inverse trends in kd profiles. p-values are shown below the r coefficient. A & C panels show TR and RA plots whereas B & D panels show kd plots.

